
Here’s a scene that has played out in some version across most SaaS boardrooms. A CFO presents the quarterly numbers. NRR is cited, say 112%. Heads nod. Maybe someone says something like “good retention story” and is thanked for that amazing observation. The conversation moves on. What the CFO didn’t notice was the lead investor pausing for half a second, doing a quiet mental adjustment, translating the 112% into what it would have been under the definition their last portfolio company used. Maybe it’s 107% in that translation. Maybe it’s 116%. The number changes shape as it travels across the table, but nobody really bothers to address that.
This is the real problem with SaaS metrics, and it has almost nothing to do with whether people understand what NRR means, because everyone in a room like that understands the concept. The problem is that board members and investors have seen these metrics calculated dozens of ways across hundreds of companies. They know the definitions vary. Some of them use that knowledge deliberately, probing for the specific version of a calculation that makes a number look less impressive, or anchoring on a benchmark from a company that calculated it differently. The information gap is rarely in the CFO’s favor.
The way to close that gap is not a slide that defines your terms. It’s knowing, with precision, exactly where your calculations sit in the distribution of possible approaches, why, and what the number would look like under a different set of assumptions. Here’s where the gaps actually live.
NRR: The metric with ten names and twenty calculation methods
Net Revenue Retention has more aliases than a career fraudster: NRR, NDR, DBNER, LTMNRR, Net MRR Retention, Dollar-Based Net Expansion Rate. Publicly traded SaaS companies have used all of these in their SEC filings, often for calculations that are materially different from one another. The name is, of course, the easy part to pin down; the definition is where things get expensive.
The basic structure is consistent enough: starting recurring revenue, plus expansion, minus contraction and churn, divided by starting revenue. But the details of each term carry real weight. On expansion alone, there are several legitimate but distinct approaches in common use. Some companies count price increases as expansion revenue. Others don’t, treating price changes as a separate phenomenon unrelated to account health. Some include revenue from usage overages above committed minimums, on the grounds that it’s real revenue from existing customers. Others exclude variable revenue entirely, arguing that it makes NRR less predictable as a forward-looking indicator. Both positions are defensible. They produce different numbers from the same underlying customer relationships.
The reactivation question is where things get genuinely contested. A customer cancels in January, returns in April. Does that April revenue count as new customer revenue or expansion from the existing cohort? How you answer affects both NRR and your new logo metrics, and there is no universally adopted standard. Then there’s cohort construction: how you handle the customer who existed at the start of the period, expanded mid-period, and churned at month eleven determines whether their expansion counts in your numerator and how their departure affects the denominator. The timing mechanics alone can shift a single customer segment’s contribution by several percentage points in either direction.
None of this means NRR is a meaningless metric. It remains probably the most information-dense single number in SaaS. But an investor who asks “how do you calculate that?” is usually not confused about the concept. They’re trying to find out which version you’re using, whether you’ve thought hard about it, and what your number becomes under their preferred definition. The CFO who can answer with specific precision — including what would change and by roughly how much under a different approach — is having a fundamentally different conversation than the one who says “standard NRR” and moves on.
ARR: Everyone’s favorite number, nobody’s cleanest calculation
Annual Recurring Revenue carries the comforting feel of a settled definition. MRR times twelve, right? In practice, however, the variations in how SaaS companies define and calculate ARR would keep an auditor occupied for a long weekend.
Start with the formula itself. Some companies use MRR times twelve. Others use last month’s GAAP revenue times twelve, which introduces revenue recognition timing into a metric that’s supposed to reflect contracted recurring value at a point in time. Others derive ARR from total contract value divided by contract length, which is clean for annual contracts and noticeably messier for multi-year deals where discounting complicates the picture considerably.
The professional services question surfaces more often than CFOs expect. The standard position is that professional services are non-recurring and belong nowhere near ARR. The reality, documented in filings from a meaningful subset of publicly traded SaaS companies, is that certain companies include professional services in ARR calculations when those services are recurring and contractually defined. An analysis of 150 publicly traded SaaS companies found several that explicitly include qualifying professional services in their ARR, with definitions ranging from “subscription-like retainers” to “premium services subject to contractual subscription terms.” The category is not clean, and the temptation to include services revenue that genuinely does recur is understandable, even if it inflates the number relative to a stricter definition.
Multi-year contracts carry their own definitional trap. For example, imagine a customer signs a three-year contract at $300,000 per year list price, but with a 15% multi-year discount, paying $255,000 per year in practice. ARR computed on the undiscounted contract value is $300,000. ARR computed on the actual billed amount is $255,000. Both approaches appear in the market. The $45,000 difference per customer is invisible in the headline number until a Quality-of-Earnings (QofE) team goes through the customer list.
That Quality-of-Earnings process is where ARR definitions stop being theoretical. One detailed analysis of a company entering a sell-side M&A process, published by a finance practitioner who works these transactions regularly, laid out the restatement math directly: reported ARR of $25 million, after removing embedded non-recurring services revenue, excluding month-to-month contracts, normalizing for snapshot-versus-average timing differences, applying a customer concentration haircut, and adjusting for multi-year discounts, came out to $17.9 million. A $7.1 million gap on a $25 million headline number, none of it involving any accounting irregularity. Private equity acquirers build ARR haircuts into their models as standard practice. The only question is whether that haircut is a surprise to the seller.
Gross margin: The quiet number with expensive surprises
Gross margin gets less attention in SaaS board presentations than NRR or ARR, partly because the concept seems simpler. Revenue minus cost of goods sold, divided by revenue. The complexity lives in what belongs in COGS.
Hosting and infrastructure: clearly yes. Third-party software licenses tied directly to delivering the product: yes. Customer support salaries: generally yes, though some companies carve out certain support functions to Sales and Marketing. Customer success: here is where things diverge meaningfully. Customer success teams that primarily serve retention and expansion tend to be classified under Sales and Marketing at many companies, while at others they sit in COGS as a direct cost of delivering the service. The classification has real consequences for reported gross margin. A company with meaningful customer success investment will show a materially different gross margin depending on where that cost sits in the chart of accounts, and neither approach is obviously wrong.
The benchmark context matters here. Benchmarkit’s 2025 report puts the median gross margin at 77% across B2B SaaS companies including services revenue. Pure software subscription gross margins run higher. Most investors apply a target of 75% or above for subscription revenue, and anything below 70% gets flagged as a cost structure concern requiring an explanation. But those benchmarks are only useful for comparison if they were built the same way your margin was. A company that has classified customer success under COGS is being benchmarked against companies that haven’t, and the gap may reflect a structural difference in cost accounting rather than an actual difference in operating efficiency.
The AI-native wrinkle is worth watching. Bessemer Venture Partners has found that scaling AI companies average roughly 25% gross margin, driven by compute and inference costs that simply don’t exist in traditional SaaS COGS. When AI-native competitors start appearing in your competitive landscape, the gross margin benchmarks that have governed fundraising and valuation conversations for a decade begin to shift in ways that haven’t been fully normalized into standard comparisons yet. A CFO who surfaces that context proactively is better positioned than one who lets a 68% gross margin sit in a deck alongside a 77% benchmark with no explanation.
The part no one says out loud
There is a less comfortable dimension to all of this worth naming directly. The definitional ambiguity in SaaS metrics persists, in part, because it is sometimes convenient for it to. A CFO whose NRR calculation includes price increases will report a higher number than one who excludes them. A company that treats reactivated churned customers as expansion rather than new logos can show a better retention story. Multi-year ARR at list price makes the business look larger than the discounted-actual approach does. These choices may all be individually defensible. They are also choices, and choices made in a specific direction.
The problem with carrying a flattering definition is not primarily the ethics of it — reasonable people genuinely disagree on some of these questions — it’s the cost structure of the eventual reckoning. When an investor or acquirer stress-tests the calculation, as they will, the credibility cost of the gap almost always exceeds whatever benefit came from looking 10% better for a few quarters. The trust that erodes when a number gets restated in a diligence process is not easily rebuilt, and it tends to color every other number in the room.
The CFO who owns their definitions explicitly knows exactly how each compares to the alternatives in common use, and can articulate the reasoning under real pressure, is in a structurally different position. This isn’t about choosing the most conservative possible definition (defensible and defensible under interrogation are different standards), it’s about knowing, at any moment, what your number would be under a different set of assumptions, and being able to answer that question before someone else in the room asks it.
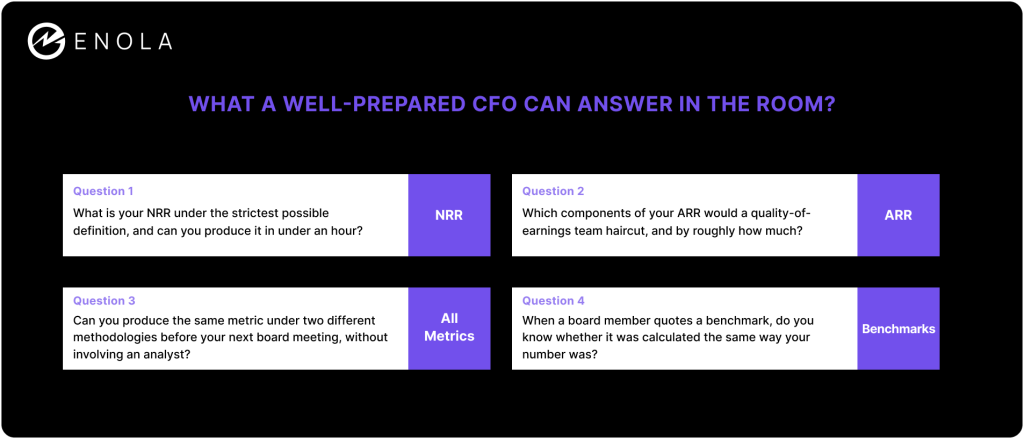
The board doesn’t need to trust that your NRR is good. They need to trust that you know exactly what it is, why you calculate it that way, and what changes if the assumptions shift. The answer to that question doesn’t live in a slide. It lives in whether the underlying data and definitions are structured to make those questions answerable in the room, not in a follow-up email the week after the board meeting, when the analyst has had time to run the right query.
This is precisely the problem AskEnola is built to solve: encoding your metric definitions in a structured, queryable layer so the alternative calculation is available before someone asks, not after someone notices.
The metrics themselves are not complicated. The work of owning them is.