
Over the years, I’ve heard the same story from hundreds of leaders: they’re drowning in data, but starving for answers. The right questions get asked often enough, yet the answers only arrive after it’s too late to act.
Imagine asking how a new customer segment is performing, only to hear back about it two weeks later, long after the campaign has moved on. Irrespective of the answer, the data will fail to inform the decision-making in this case, thereby missing the whole point of analytics.
As I often tell my team, “Insight delivered late is just expensive hindsight.”
In the last few years, a lot has changed in the way we work, but business leaders continue to tell me similar stories. They have countless dashboards and terabytes of data, along with ChatGPT and various co-pilots, yet they find themselves waiting to extract a clear answer.
This begs an obvious question: in a world of instant data and AI, why are most businesses moving at the same old pace (fatally slow, some would say)?
The Data Paradox: More Information, Slower Decisions
From app usage logs to sensors on the logistics fleet, the volume of available data is staggering for most companies. Yet many organizations are data-addicted, not data-driven. They keep collecting data, thinking it will yield insights, but often it just creates noise.
A lot of the collected data goes unused because teams spend too much time gathering and cleaning it. Dashboards pile up, but insights stall out. When the CEO finally asks a question, the answers aren’t ready. Meanwhile, markets move fast. Trends now shift by the hour, and customers change their minds overnight. If your insights come late, you risk being left behind.
The pressure is very real in the age of AI.
However, despite an acknowledgement of the acute pain in decision-making, leaders make do because they think there is no other option. As a result, they keep lagging.
That lag has a price, of course.
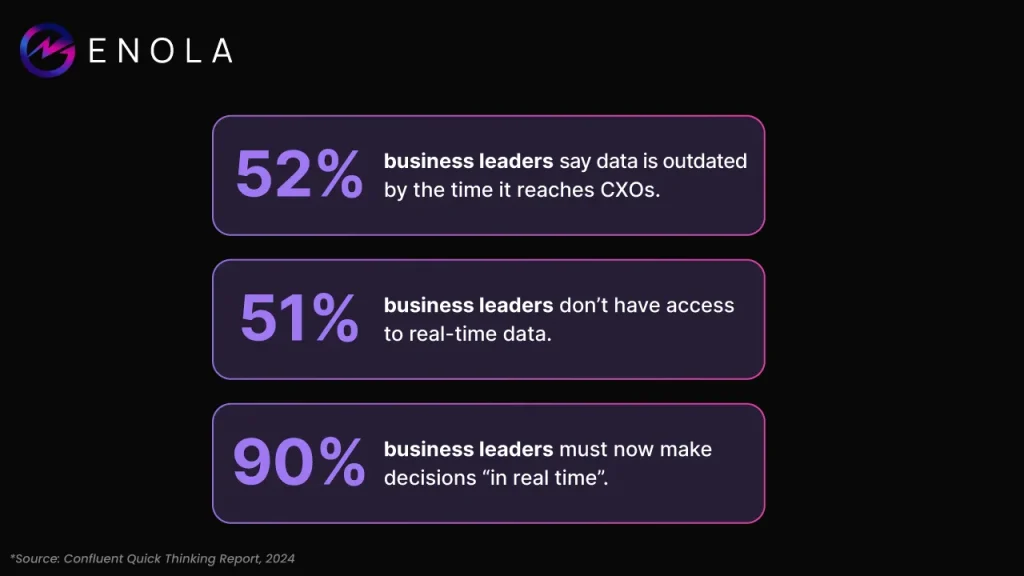
McKinsey says that if managers waste about half of their decision-making time, it can translate into roughly 530,000 lost workdays and $250 million of wasted effort per year at a Fortune-500 scale.
Those are massive numbers. They tell us that slow decisions aren’t abstract; they cost money, wasted effort, and missed opportunities.
The Dashboard Delusion
Don’t we have tools to solve for this? We certainly do. There are all sorts of fancy Business Intelligence systems available in the market, and to their credit, they have been getting better. But then, why does the picture look so bad right now, which is to say, why do BI tools fail us so often?
Part of the reason is that most of these tools are built for hindsight, not foresight. Traditional dashboards update daily or weekly, so they always report on what has already happened. Without real-time processing, BI systems force companies into batch mode, and that means delayed decision-making.
Then there’s the single source of truth challenge. Many teams struggle to agree on which data is “official.” Nearly half of large enterprises say they cannot trust their CRM as a true single source of truth for customer information. Across all functions, around 80% of companies struggle to unify data assets into a single, authoritative repository. That leaves every department working in its own silo and nobody quite sure which numbers to believe.
Imagine a retail chain with separate inventory and sales dashboards. Marketing sees one set of figures and ramps up promotions. Operations follow a different report and cut orders because their dashboard shows overstock. By the time anyone reconciles the two versions of truth, revenue has been lost and costs have spiked.
Those delays hit especially hard in fast‑moving sectors.
A pricing tweak in SaaS might be outdated by the time the daily report runs. A supply snag in manufacturing can cascade for days before it shows up in analytics, and by then, it’s too late to respond.
Decision Velocity: The New Competitive Edge
The companies that are winning in 2025 have flipped the script: they treat speed as a competitive asset, and they know that moving quickly can actually improve decision quality.
In fact, organizations making fast decisions are twice as likely to make high-quality decisions as the slower ones. In other words, speed and quality go hand-in-hand at top firms.
Decision velocity lets you act on opportunities and problems before they escalate. A moment’s delay can mean a missed sale or an unaddressed risk. Conversely, acting even a day earlier can multiply your returns.
The leaders who win want AI to make processes faster and smarter. They’re not looking for flashy reports; they want answers delivered while they can still act on them.
What It Takes to Move Lightening-Fast
If speed is the goal, what needs to change? It turns out it’s about more than just tools. Building true decision velocity means rethinking the whole process:
Continuous Data Flows:
Data needs to be streamed and integrated in real time, not delivered in overnight batches. That means connecting every silo (CRM, ERP, marketing, etc.) so any question can be answered against live data. Legacy pipelines that update once a day simply can’t cut it when you need answers now.
Context and Metrics Built-In:
Systems should frame answers in terms of your business goals. Good analytics doesn’t just return raw numbers; it applies your KPIs, thresholds, and benchmarks automatically.
For example, if you ask why churn spiked, the system should immediately apply your churn definition and compare against targets. That way, insights are ready for action, not just extra charts.
Automation with Oversight:
Routine analyses should happen automatically, so stakeholders get alerts or insights without manual intervention. (Think anomaly detection or precomputed forecasts.) Of course, automation only works on a foundation of clean, governed data and clear business logic. With that in place, you free up your team to focus on interpretation and strategy.
Agile Culture:
Finally, the organization must value quick learning. Decision velocity often means acting on imperfect information and iterating. Companies that succeed empower teams to move on their own and update the system as they go. In practice, this means fewer red-tape meetings and faster experiments.
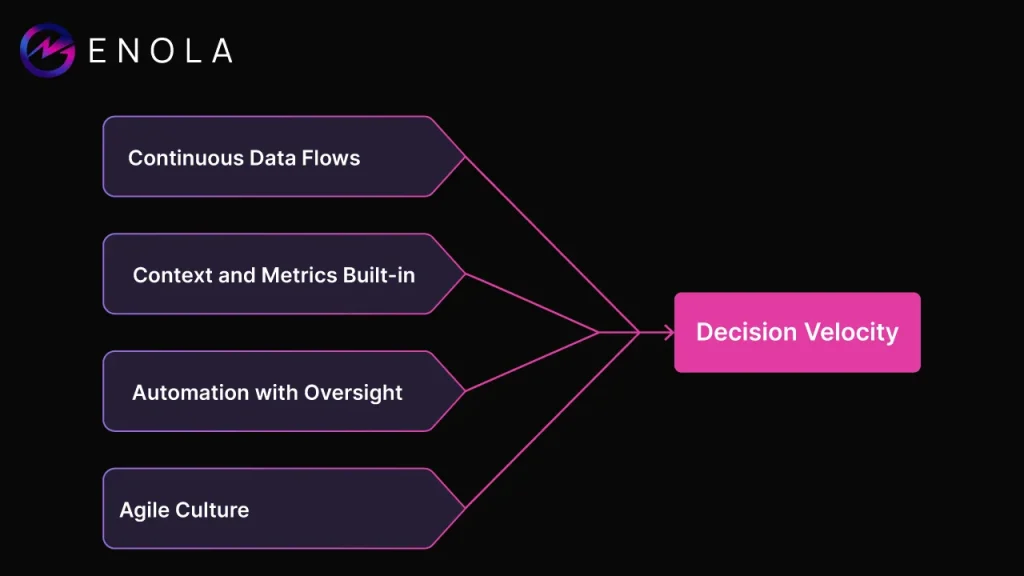
None of these steps is a magic button on its own – it’s the combination that delivers real-time decision-making.
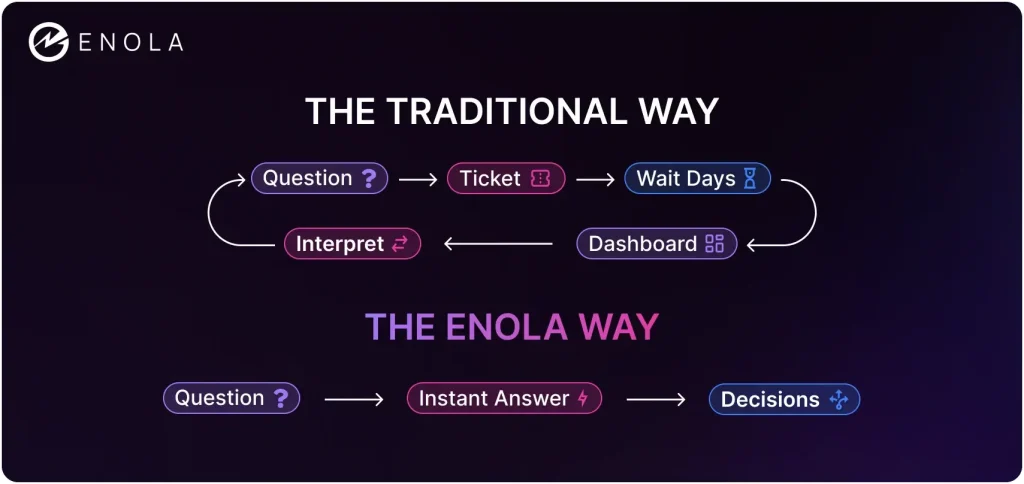
The goal is for a crucial business question to be answered in minutes, not days or weeks. That changes everything.
Why We Built Enola
This vision of amping up decision velocity exponentially is exactly why we built Enola.
After decades helping companies with data, I saw that leaders needed more than another dashboard; they needed a partner in decision-making.
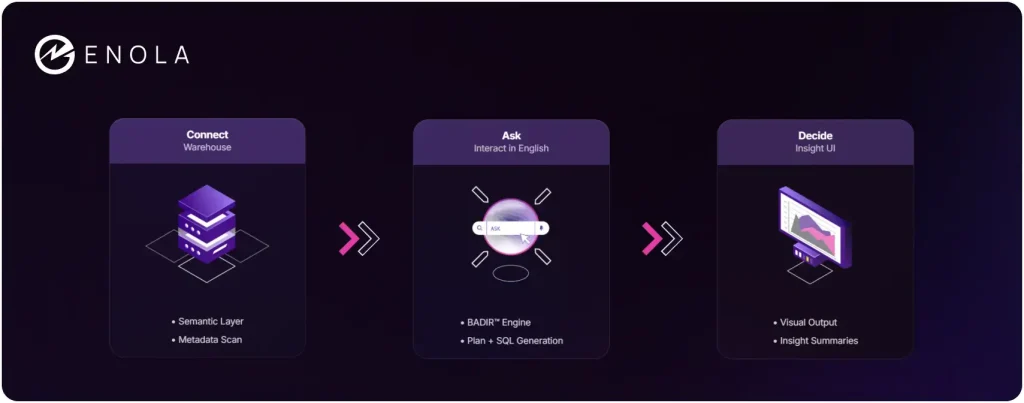
Enola is designed to be that “super-analyst” who never sleeps. She connects to all your data sources, understands your business context, and answers plain-English questions in seconds. You don’t sift through reports; you just ask, discuss, and move on after getting the insights you need.
Enola isn’t just an LLM slapped on a database. She’s trained with domain knowledge and your company’s logic. Ask her, “How did last week’s flash sale perform by region?” and she will immediately surface the key insight. Under the hood, it’s engineered for speed, with live data, embedded intelligence, and the analytics smarts you’d expect from a seasoned management consultant.
We built her to cut days off the decision cycle, so leaders can act fast with confidence.
Decision velocity isn’t hype; it’s a game-changer. Attesting that is quite easy: go meet Enola at askenola.ai, and see how fast your next question can be answered.
This post was originally published on Piyanka Jain’s Substack.
FAQs:
How can I make faster business decisions using data?
Making faster data-driven decisions requires two things: reducing the time between asking a question and getting a reliable answer, and ensuring the answer is connected to live, accurate data. The most effective approach is using AI analytics tools that connect directly to your data warehouse and answer business questions in natural language — eliminating the analyst queue and dashboard bottleneck that slow most organizations down.
What slows down data-driven decision making in most companies?
The biggest delays in data-driven decision making come from three sources: data silos (data spread across disconnected systems), analyst dependency (business questions requiring technical staff to generate reports), and dashboard lag (static dashboards that don’t update in real time or can’t answer unexpected questions). Companies that resolve these three friction points typically cut their decision cycle from days to hours or minutes.
What is decision velocity and why does it matter?
Decision velocity is the speed at which an organization can move from identifying a business question to taking informed action. High decision velocity means that when a market signal appears — a competitor move, a customer churn spike, a revenue anomaly — leaders can understand its cause and respond within hours rather than weeks. Research consistently shows that companies with high decision velocity outperform slower competitors on revenue growth and operational efficiency.
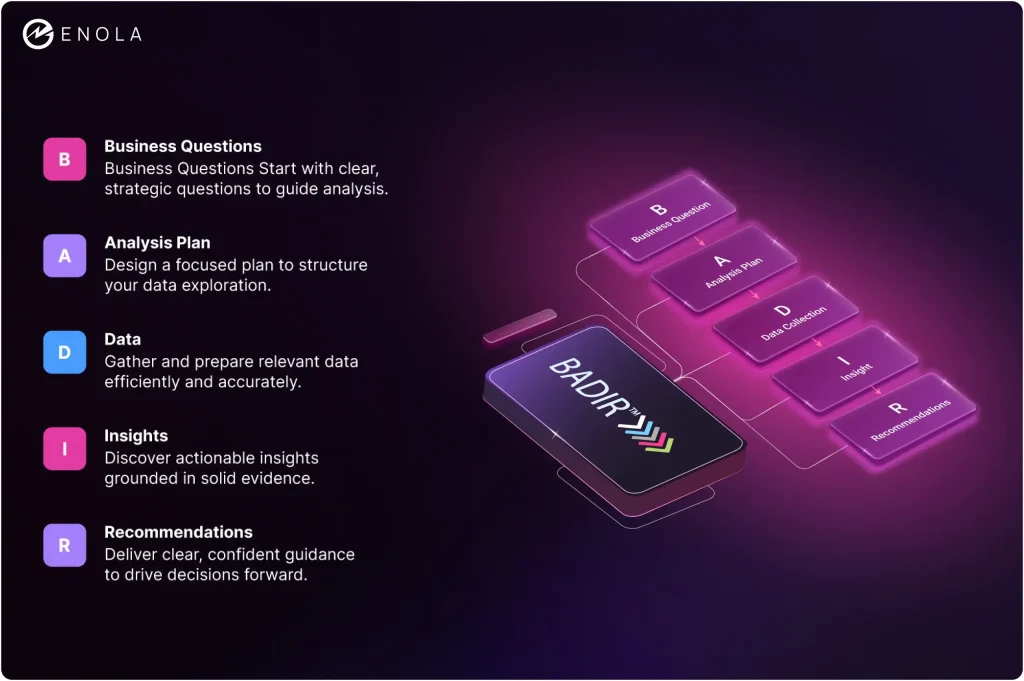
How does the BADIR framework help with faster decision making?
The BADIR framework (Business Questions, Analysis Plan, Data, Insights, Recommendations) is a structured methodology for turning business questions into actionable decisions efficiently. By starting with a clear business question rather than raw data exploration, BADIR prevents analysis paralysis and ensures that every analytical step is tied to a real decision need. AI analytics tools built around BADIR can automate the middle steps — analysis plan, data gathering, and insight generation — leaving leaders to focus on the recommendation stage.
What role does AI play in speeding up business decisions?
AI accelerates business decision making by automating the most time-consuming parts of the analytics process: data retrieval, pattern identification, and insight synthesis. Instead of a data analyst spending hours pulling reports and generating visualizations, an AI analytics platform can process the same question in seconds by querying live data sources, applying business logic, and returning a structured, decision-ready answer. This compression of time-to-insight directly translates into faster, more competitive decision making.
How does Enola solve the slow decision-making problem?
Most business leaders struggle to get timely insights because dashboards update overnight and data lives in silos. Enola connects directly to live data streams across CRM, ERP, marketing, and finance systems, then applies your KPIs and thresholds automatically.
This means you can ask a question like “Why did churn spike this morning?” and get an answer in seconds rather than waiting days. The result is faster reactions to market changes and fewer missed opportunities.
Why is decision velocity so important in 2025?
Markets shift by the hour, and companies that react faster are twice as likely to make high‑quality decisions compared to slower competitors. Delays in answering critical questions can cost millions in lost revenue or wasted effort.
Enola boosts decision velocity by combining real-time data, embedded business logic, and automation so leaders can pivot before costs rise or opportunities disappear.
Can I test Enola with questions before deploying it?
Yes.
Enola’s sandbox lets you explore how it works using sample datasets or connect your own data for a pilot run. You can ask plain-English questions, see how the platform interprets your business context, and experience real-time answers without setup delays.
How is Enola different from dashboards and no-code analytics tools?
Traditional dashboards are backward-looking and often refresh once a day. No-code tools help visualize data but still require manual modeling and multiple iterations with analysts. Enola flips this model.
It connects to live data, understands your definitions for metrics like revenue or churn, and provides contextual answers instantly with no dragging, dropping, or exporting required.
Does Enola replace dashboards completely?
For many companies, yes. Dashboards remain useful for historical reporting, but Enola eliminates the wait times they create for real-time decisions. Instead of hunting through multiple reports, teams can ask questions directly and get answers aligned with company metrics.
This shift reduces noise, increases clarity, and makes decision-making faster and more confident.
What kind of ROI can we expect from Enola?
McKinsey estimates Fortune 500 companies lose up to $250 million annually from slow decision cycles. By replacing those delays with real-time insights, Enola helps reduce wasted workdays, capture opportunities faster, and prevent costly missteps.
Most teams see value within days, not months, and the impact compounds as more decisions shift to Enola.
Related Blog: