
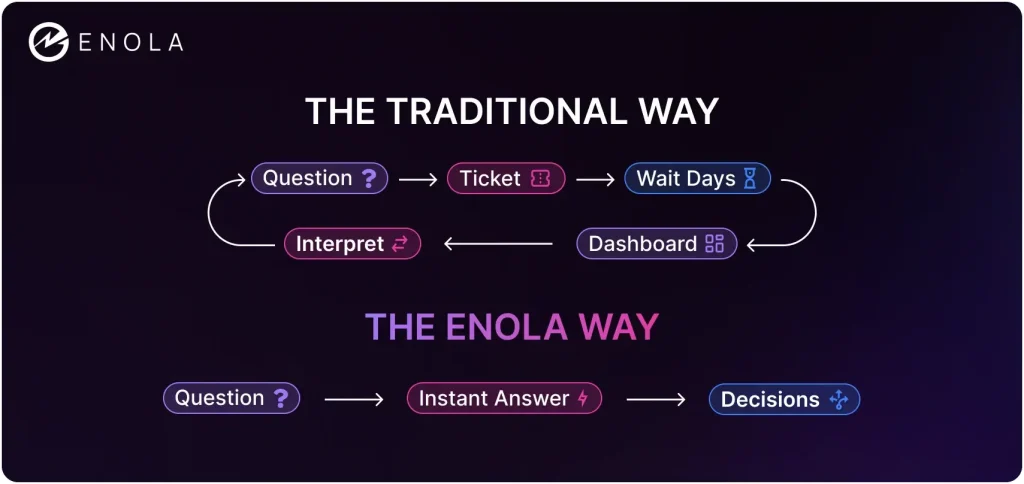
In today’s data-driven world, as businesses seek no-code analytics and dashboard alternatives, traditional BI dashboards are simply not enough. Business users and AI systems alike are growing impatient with static charts and hours-long report cycles, and in a fast-moving world, waiting on dashboards or backlogged analysts just doesn’t cut it.
Industry analysts note that dashboards are often “static, inflexible, and siloed” relics of a bygone era. It’s currently predicted that by 2025, advanced AI-powered analytics (like natural-language and augmented tools) will influence more business decisions than dashboards ever did.
Static visualizations can’t keep up with today’s fast-paced decision-making needs, and business intelligence tools like Tableau and Power BI alternatives are struggling to deliver the real-time insights leaders demand.
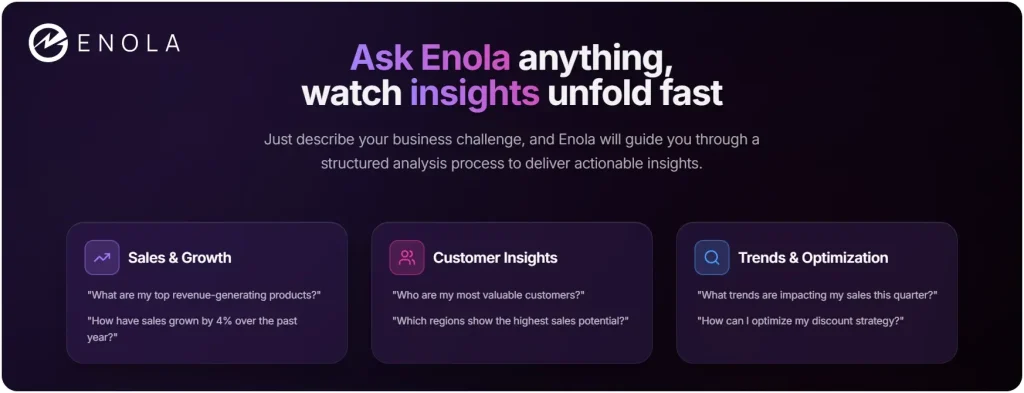
Today’s leading firms are turning to No code or Low code approaches, enabling anyone (CEO, product manager, marketer, or analyst) to simply ask an AI assistant like Enola a question and instantly receive a data-backed answer, narrative, and recommendation.
The future belongs to conversational analytics platforms that understand natural language and deliver instant, actionable insights.
Dashboard Fatigue: The Real Problem Plaguing Business Intelligence
Dashboard fatigue isn’t just a buzzword, but a productivity crisis costing businesses millions.
Research shows that teams using overpopulated dashboards are failing to deliver on the value within their data. Approximately 2.5 quintillion bytes of data are produced every day (fun fact: there are 18 zeros in that number!).
Yet, only a fraction of this data actually generates insights and helps businesses.
When dashboards are stuffed with tables and charts, they result in cognitive overload, making it challenging for users to concentrate, make decisions, or retain important details.
This is why discussions about BI tools now focus on no-code analytics (or sometimes to low-code analytics).
Why Traditional Dashboards Are Failing:
- Fixed Scope, Low Agility: Dashboards excel at snapshot monitoring (e.g., daily KPIs or production metrics), but they struggle with ad-hoc questions. Dashboards were originally designed to monitor known metrics over time, but modern business users need to discover new insights rather than just monitor existing ones.
- Long Update Cycles: Building or updating a dashboard often requires coordination with data teams or developers. Reports pile up and become stale. Most dashboards are quickly abandoned, leaving executives waiting weeks for insights instead of getting instant answers.
- Data Silos & Inconsistency: Dashboards live in siloed BI tools or spreadsheets. Conflicting definitions (e.g. different “revenue” calculations) and outdated data lead to inconsistent KPIs and mistrust. This mismatch between user needs and tool capabilities creates an insurmountable gap.
- Cognitive Overload: Executives get green/red lights and charts, but often no explanation of why. As one observer noted, dashboards “excel at providing a summary look of the business,” but can’t explain underlying drivers.
Analytics expert Piyanka Jain, founder and CEO of Aryng, explains the core issue:
“Analytics is the science of applying a structured method to solve a business problem using data and analysis to drive impact ”.
How No Code Analytics Delivers 90% Cost Reduction
But first,
What is No-Code Analytics?
No-code analytics is the next evolution of business intelligence and embedded analytics. Instead of navigating menus and filters, users simply ask questions in natural language.
Conversational analytics platforms like AskEnola eliminate these bottlenecks by providing an AI Super-Analyst that understands business context and delivers insights in minutes rather than weeks.
Where traditional analytics projects might take weeks and cost hundreds of thousands of dollars, no-code or low-code analytics delivers results in real-time at a fraction of the cost.
This 90% cost reduction stems from the shift from rigid dashboards to conversational analytics. This is how Enola does it:
Instant, no-code analytics and predictive analytics breakthrough:
Ask a question in plain English and receive answers in minutes. No SQL, filters, or dashboard setup required. Enola connects to your data warehouse (Snowflake, Redshift, BigQuery, etc.) in minutes, applies best-in-class analytics frameworks to your queries, and provides responses designed to give you instant clarity.
Zero analyst bottlenecks:
Forget waiting on data scientists for custom reports— an analyst handles queries on demand, and never gets tired.
Automated maintenance:
Data connections don’t need updating, and a Super-Analyst like Enola keeps getting better every time you ask her something, eliminating ongoing maintenance and upkeep.
Immediate usability:
Business users jump straight into querying without training, thanks to a chat-style interface and context-aware BADIR™ framework that tailors insights to each role.
The cost advantages are substantial: Teams can test hypotheses, explore data relationships, and make decisions at the speed of thought rather than the speed of traditional analytics processes.
A McKinsey survey found organizations that make decisions quickly are 2× more likely to make high-quality decisions and outperform slower peers.
Beyond Dashboards: The Future of Self-Service Analytics
No-code analytics or Low-code analytics platforms powered by conversational AI represent the next evolution beyond traditional dashboard alternatives.
These platforms combine the accessibility of natural language with the power of advanced analytics, enabling every team member to become a data-driven decision maker.
The key differentiator is context awareness.
Benefits of No-Code Analytics for Self-Service BI and Dashboard Alternatives:
True Self-Service Analytics:
Product analytics, sales, operations, and finance teams can query data independently. Just ask Enola for instant answers without SQL or dashboard setup.
Consistent BI Tool Integration:
Governed semantic logic ensures that whether you view results in Power BI, Tableau, Excel, or chat, definitions and metrics remain aligned with no conflicting dashboard numbers!
Embedded Predictive Analytics:
An AI analyst can embed into apps, email, or Slack and include AI-driven alerts and automated anomaly detection, boosting analytics adoption and providing proactive insights without hunting through dashboards.
Actionable AI-Powered Insights:
Enola delivers not just charts but narrated analysis, root-cause explanations, and next-step recommendations, transforming BI tools comparison into a seamless decision-making experience.
In short, No-code Analytics AI meets the key pain points of modern leaders: it combats dashboard fatigue (which affects about a third of CX pros), ends the report backlog, reduces reliance on IT/data teams, and cuts through information overload with clear answers.
AskEnola: The AI Super-Analyst Revolution
Enola is an AI Super-Analyst that embodies the no-code analytics vision.
Unlike generic AI tools that provide surface-level insights, Enola understands your specific business context, automatically catalogues all your data sources, and delivers truly actionable recommendations.
Whether you’re evaluating Looker alternatives, Tableau alternatives, or Power BI alternatives, Enola stands apart.
The platform’s BADIR™ framework – Business Question, Analysis Plan, Data Collection, Insights, and Recommendations, ensures every interaction follows a structured approach to drive real business impact.
This methodology, developed by analytics expert Piyanka Jain, has driven over $20M+ in business impact across hundreds of enterprises.
Traditional analytics approaches often suffer from low utilization rates and deliverables setbacks. The primary reasons include complexity, accessibility issues, and the time required to generate actionable insights.
The table below highlights how AskEnola compares to these traditional BI tools across key metrics:
| Features | AskEnola | Traditional BI |
| Speed to Insight | Lightning-fast: Answers in seconds (ask and get)—no waiting. |
Glacial: Dashboards/Reports often take days–weeks to create or update |
| Ease of Use | Instant insights: Ask in plain English and get context-aware answers. Quick setup. Start querying in minutes. |
No NLQ: GUI/drag-and-drop only; analysts translate needs into reports. Complex setup takes months. |
| Analyst Dependency | Low: Business users self-serve with BADIR™ backing (analysts freed). |
High: Each new metric/report requires analyst work and BI development |
| Business-Goal Alignment & Accuracy | Enterprise-grade trust: Built on the BADIR™ framework, always aligned to business objectives. Delivers warehouse-native, goal-first insights with near-zero hallucinations. |
Structured and reliable: Insights are mostly grounded in business goals and supported by formal methods like BADIR™; some auto-insights may be data-led. Accuracy is strong, with rare AI drift |
| Data Security | 100% secure: No data movement, no copying, no storage—queries run in place. |
High: Connects to your systems; some tools cache or store extracts |
| Cross-Team Adaptability | Universal: One interface for marketing, sales, finance, product—everyone speaks the same language. |
Siloed: Each department needs its own dashboards, separate development |
Slash Analytics Spend by 90% with AskEnola:
Enola eliminates most recurring analyst and dashboard maintenance expenses. Organizations report up to 90% lower analytics spend compared to traditional BI, thanks to:
- Natural-language queries that replace complex dashboard builds.
- Automated semantic-layer creation with zero manual modeling.
- In-warehouse queries that avoid data movement and replication.
She goes beyond simply answering questions as she guides leaders to ask sharper inquiries, uncovers patterns that humans might overlook, and delivers context-aware recommendations perfectly aligned with your strategic objectives.
Here’s how AskEnola delivers unmatched speed, adoption, and ROI across the analytics journey:
AskEnola Delivers Real-Time Answers in Minutes:
While legacy dashboards can take days or weeks to refresh, Enola delivers answers in minutes. At up to 10x the speed of both traditional BI tools and generic AI analytics platforms, she empowers teams to iterate hypotheses, optimize campaigns, and pivot strategically in real time.
Boost Insight Adoption Above 80% with AskEnola:
Traditional analytics often suffer from low adoption, only 20% of generated insights inform decisions. Enola’s conversational interface democratizes data access, driving utilization above 80% and multiplying the value delivered per dollar invested.
Instant ROI: 15-Minute Setup for AskEnola
Setup takes just 15 minutes, not months. AskEnola’s plug-and-play architecture and BADIR™-driven analysis plan ensure immediate ROI through:
- First-week time savings equivalent to hundreds of analyst hours.
- Automated data cataloging that replaces siloed dashboards and manual ETL.
- Role-tailored insights that minimize follow-up questions and rework.
Accelerate Growth with AskEnola’s Competitive Advantage
Faster, broader insights translate into:
- Quicker campaign optimizations, boosting marketing ROI by up to 20%.
- Real-time operational adjustments, reducing stock-out costs by as much as 15%.
- Data-backed leadership decisions, accelerating product launches and go-to-market timelines by weeks.
- Enhancing CRM analytics and predictive analytics workflows for faster customer insights.
Today’s choice isn’t about abandoning static dashboards but about how fast you can adopt conversational analytics with no-code tools like AskEnola to unlock 90% cost savings and 10x faster insights.
Embrace this shift to empower every team member to make confident, data-driven decisions. Explore Enola or try the Sandbox to get started.
FAQs:
What makes AskEnola the best No-Code analytics solution for business intelligence?
AskEnola transforms traditional business intelligence by replacing static dashboards with conversational, no-code analytics.
You ask questions in natural language about predictive analytics, product analytics, or any business metric, and Enola delivers AI-powered insights instantly instead of waiting weeks for BI reports.
Ready to revolutionize your business intelligence approach? Try Enola’s Sandbox and get your first insight in minutes.
How does Ask Enola integrate with existing business intelligence and BI tools?
Enola seamlessly integrates with your current business intelligence stack, sitting atop your governed semantic layer. This ensures consistency whether you’re using self-service analytics queries, traditional dashboard alternatives, or embedded analytics in other tools.
No more conflicting numbers between predictive analytics models and standard reports. Read more about the story of Enola.
Why does AskEnola achieve higher adoption than traditional business intelligence platforms?
AskEnola’s conversational interface makes business intelligence accessible to everyone, from executives needing AI-powered insights to analysts running complex predictive analytics.
The no-code analytics approach eliminates technical barriers, while embedded analytics capabilities bring insights directly into workflows. This drives adoption rates above 80%, far surpassing traditional BI tools comparison studies.
Ready to boost your team’s data culture? Start your free Sandbox session now, read the document for more.
How does AskEnola deliver secure embedded analytics for business intelligence?
Enola runs queries directly in your data warehouse (Snowflake, Redshift, BigQuery), providing embedded analytics without copying or storing data. This approach ensures enterprise-grade security for business intelligence while delivering self-service analytics inside Slack, email, or your internal apps.
Role-based access maintains data governance across all predictive analytics and product analytics use cases. Need detailed security specs? Visit our product page.
Can Ask Enola really reduce business intelligence costs by 90% compared to traditional BI tools?
Yes, by eliminating analyst bottlenecks and dashboard maintenance while providing true self-service analytics, Enola slashes business intelligence spend by up to 90% compared with traditional BI tools comparison benchmarks.
The no-code analytics approach eliminates expensive dashboard alternatives and reduces dependency on technical teams for AI-powered insights.
Learn how we achieved this milestone on our About Ask Enola page, or, try Enola’s Sandbox and get your first insight in minutes.
Related Blog: