
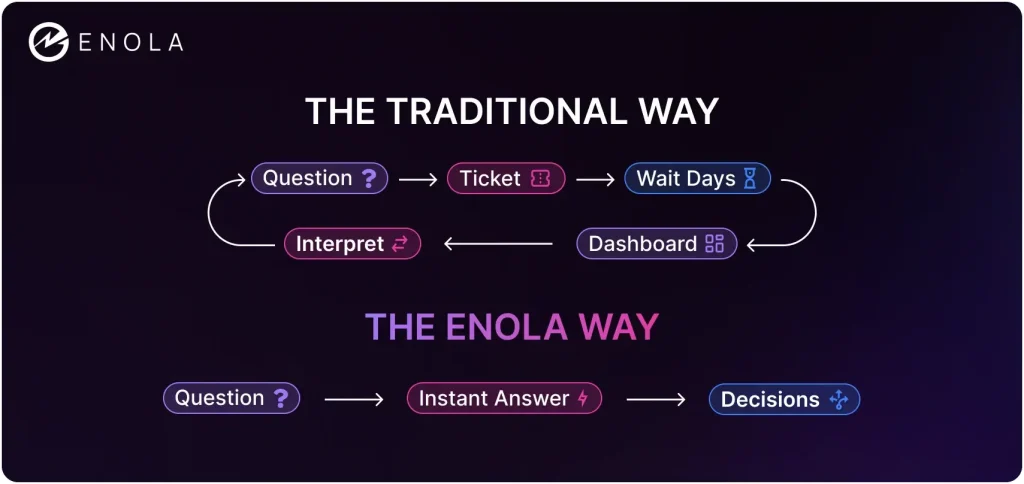
The world of business intelligence is shifting beneath our feet. While Tableau has long reigned as the gold standard for data visualization, business leaders are increasingly asking a fundamental question: Is there a better way to get insights from data without wrestling with complex dashboards and waiting weeks for analyst support?
Tableau’s steep learning curve and dashboard-heavy approach can leave non-technical teams struggling to get insights.
That’s why many companies are turning to more intuitive tools that democratize data and let anyone get answers without special skills.
The answer lies in a new generation of analytics platforms that prioritize no-code analytics and self-service insights over traditional dashboard-centric models.
With no-code or low-code architectures, these Tableau alternatives transform how organizations interact with data, making analytics truly accessible to everyone, not just to data professionals.
Why Organizations Are Moving Beyond Traditional BI Tools
Research shows that 35% customer experience professionals spend too much time looking at dashboards containing an overwhelming amount of information, leading to what experts call “dashboard fatigue“.
The core issues plaguing traditional BI include:
- Decision Paralysis: Too many dashboards and metrics overwhelm leaders, delaying decisions and reducing business impact.
- High Barriers to Entry in BI: Complex interfaces requiring extensive training limit adoption to technical users.
- Slow Time-to-Insight: Building and updating dashboards can take weeks or months, making insights stale by the time they’re delivered.
- Limited Conversational Analysis: Static dashboards can’t adapt to the natural way business leaders ask questions about their data.
Here are the key factors to consider:
| Factors | Key Considerations |
| Scalability | Platform should be cloud-native and handle large, growing datasets without performance issues. Must scale from 10 users to 10,000 queries daily. |
| Ease of Use | Should cater to business users, not just data experts. Conversational or no-code interfaces (like AskEnola) allow decision-makers to get insights without SQL or dashboards. |
| Self-Service Analytics | Enables users to move from question to answer independently. Non-technical users should be able to drill down, filter, and follow up without relying on BI teams. |
| Real-Time Data Integration | Must connect directly to live sources (Snowflake, BigQuery, Redshift) for fresh data. Enola runs real-time queries, avoiding delays of pre-built reports. |
| Governance and Accuracy | Tool must ensure data governance and validated insights. Enola uses BADIR™ methodology to prevent hallucinated answers and maintain enterprise-grade accuracy. |
| Cost and Maintenance | Dashboards are costly to build and maintain. Tools like Enola reduce overhead and deliver up to 90% cost savings by removing dashboard dependency. |
| Security and Compliance | Should provide row-level security, access controls, and compliance with GDPR, SOC 2, etc. Crucial for companies handling sensitive customer data. |
Below we compare seven top Tableau alternatives – AskEnola, Microsoft Power BI, Google Looker, Sisense, ThoughtSpot, Metabase, and Zoho Analytics – all of which focus on accessibility for every user.
AskEnola: No Code Analytics That Eliminates the Learning Curve
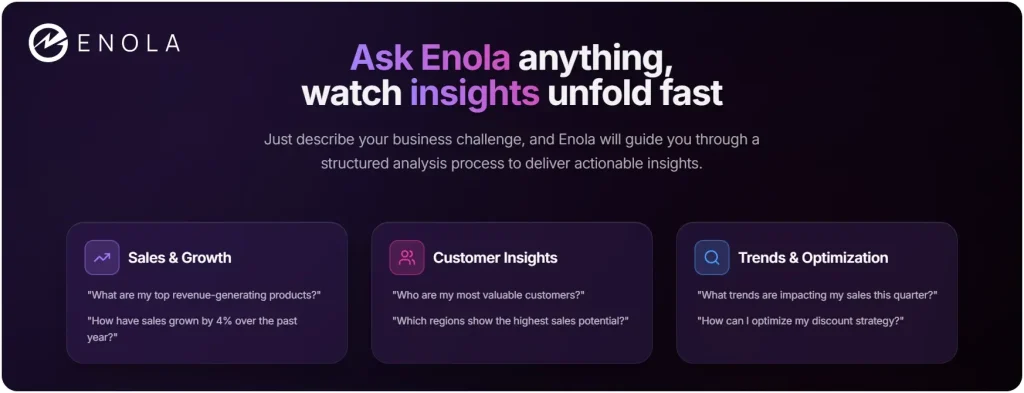
AskEnola represents the future of business analytics: a conversational, no-code AI Super-Analyst that transforms how teams interact with data. Unlike traditional BI tools that require technical expertise, Enola allows users to get insights simply by asking questions in plain English.
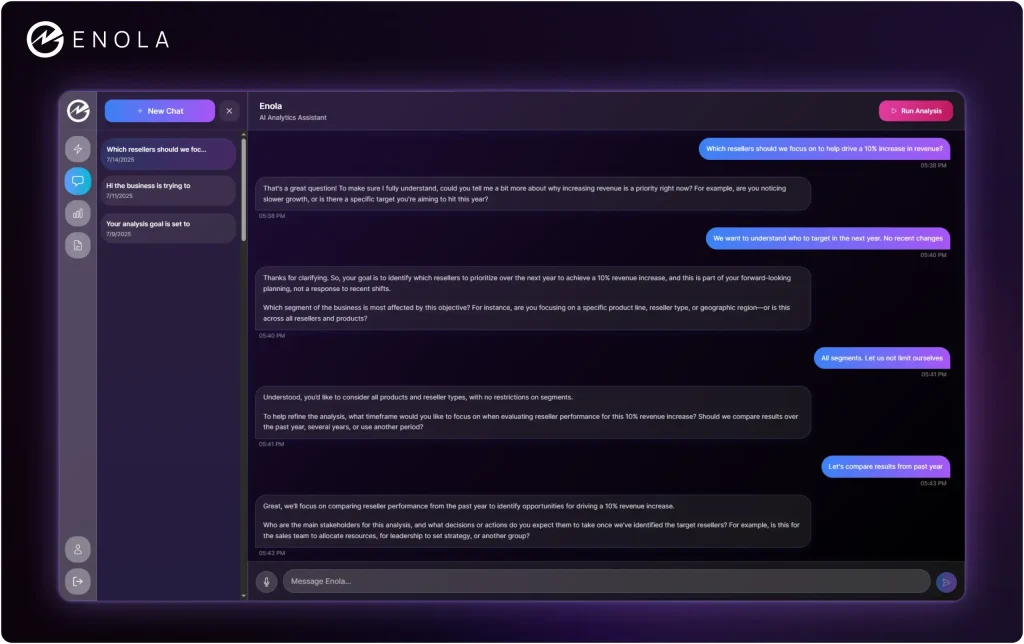
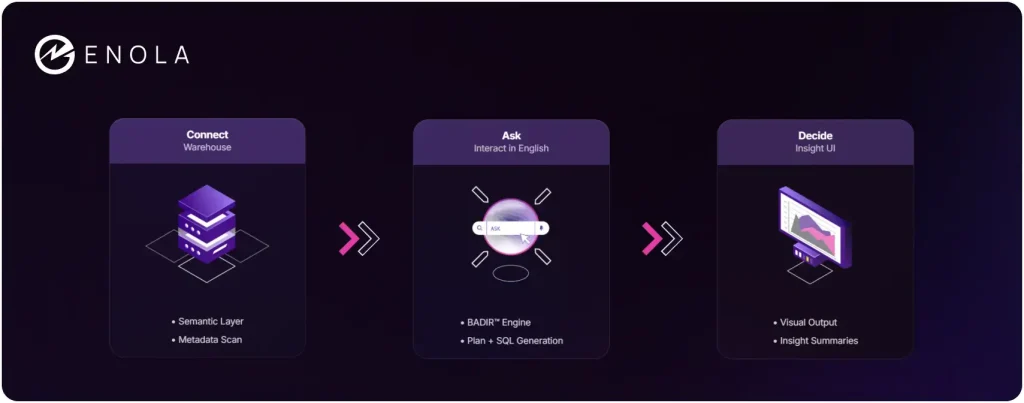
Enola is designed for business users who want instant answers without relying on dashboards or SQL. She connects directly to your data warehouse (Snowflake, BigQuery, Redshift, etc.) in minutes and automatically scans your metadata and builds a semantic layer.
Key Features
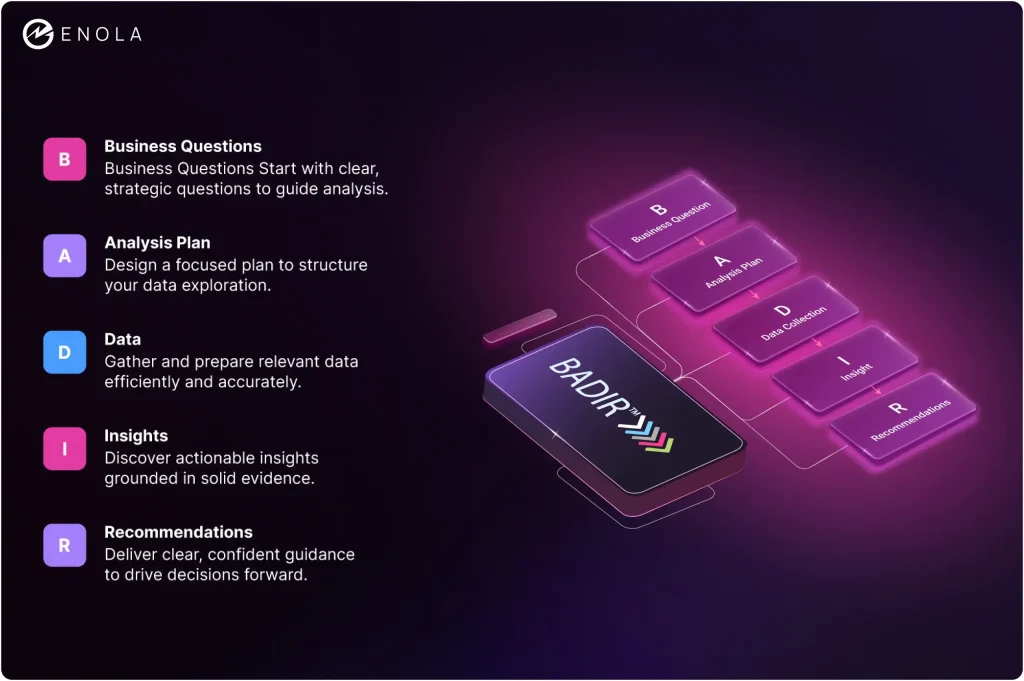
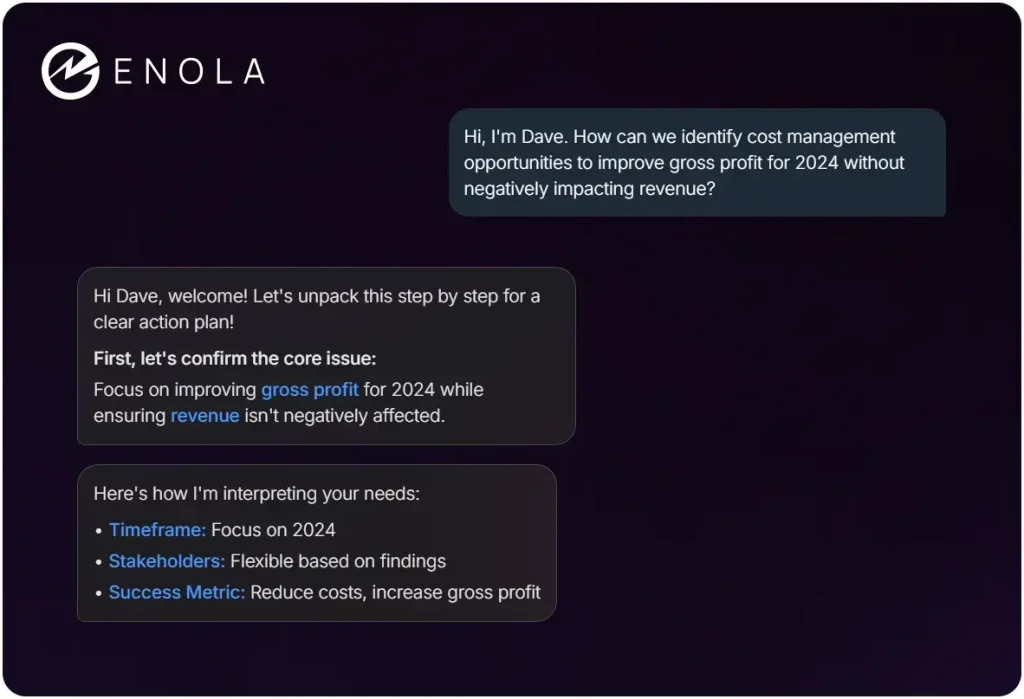
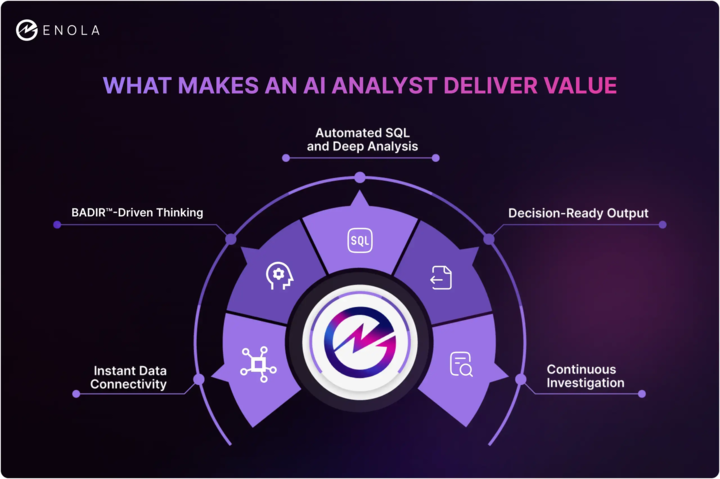
- BADIR™-Powered Intelligence: Enola follows a proven five-step methodology (Business question, Analysis plan, Data collection, Insights, Recommendations) used in millions of dollars of consulting projects.
- Direct Warehouse Connection: Connects securely to Snowflake, BigQuery, Redshift, Azure SQL, and other major data warehouses without moving data.
- Real-Time Analysis: Generates and executes SQL queries on-the-fly to deliver live insights in minutes.
- Executive-Ready Output: Provides narrative summaries, root-cause analysis, and strategic recommendations tailored to your role.
Pricing
Custom pricing based on data volume and usage. Setup takes less than 15 minutes with no manual modeling required.
Learn how Enola works and try it yourself in the Enola Sandbox.
Verdict
Enola removes dashboards entirely, replacing dashboard fatigue with natural-language answers.
Her conversational interface, direct warehouse queries, and automatic semantic layer address every limitation found in traditional tools, making data truly self-service for business teams.
Microsoft Power BI: Dashboard-Heavy But Microsoft-Integrated
Microsoft Power BI remains one of the most popular Tableau alternatives. It provides an intuitive drag-and-drop interface that appeals to Excel and Office users, making it relatively easy for teams already inside the Microsoft ecosystem.
Key Features:
- Microsoft Ecosystem Integration: Seamless connectivity with Azure, Excel, and other Microsoft products.
- DAX Language Support: Powerful data-modeling capabilities through Data Analysis Expressions.
- AI-Powered Features: Includes Copilot for natural-language queries and automated insights.
Limitations:
- High technical barrier: Requires expertise in DAX formulas and custom measures, making it challenging for non-technical users.
- Dashboard-first approach: Built for dashboard workflows rather than conversational analytics, limiting ease of exploration.
- Performance and tier limits: Struggles with large datasets and offers restricted data-refresh rates in the free tier.
Verdict:
Power BI offers affordable dashboards for Office users; however, its complexity, DAX requirements, and refresh limits can hinder self-service.
AskEnola eliminates those hurdles by transforming plain-English questions into actionable insights, without the need for DAX or dashboard upkeep.
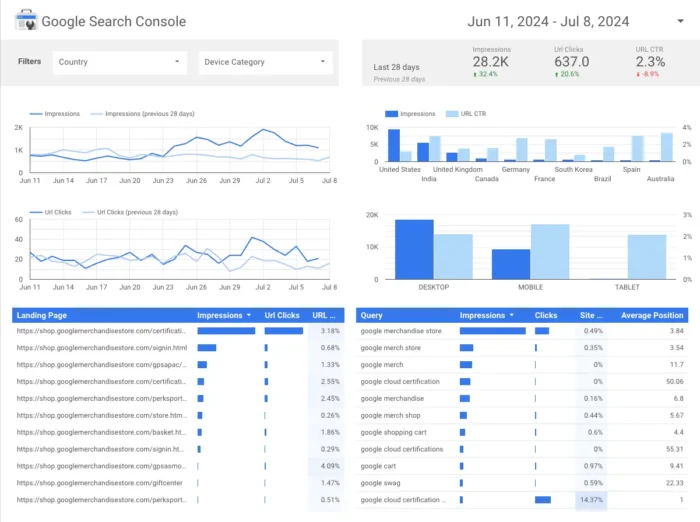
Google Looker Studio: Technical Solution for Data Teams
Looker Studio (formerly Google Data Studio) provides a cloud-based platform for data exploration and analytics. As part of Google Cloud, it offers strong technical capabilities but requires significant setup and maintenance.
Key Features:
- LookML Semantic Layer: Powerful data-modeling language for creating reusable business metrics.
- Google Cloud Integration: Native connectivity with BigQuery and other Google services.
- Version Control: Git-based approach for managing analytics code.
- Custom APIs: Extensive customization options for developers.
Limitations:
- High technical dependency: Requires LookML expertise and ongoing support from dedicated data teams for setup and maintenance.
- Limited self-service capability: Complexity makes it less user-friendly for business users seeking independent analytics.
- Cloud lock-in concerns: Optimized for Google Cloud, which can create challenges for organizations using multiple cloud or hybrid data sources.
Verdict:
Looker is powerful but developer-centric, relying on LookML and significant engineering effort.
AskEnola bypasses modeling languages altogether, connecting directly to warehouses and using natural language, so business users get insights without writing code or hiring LookML specialists.
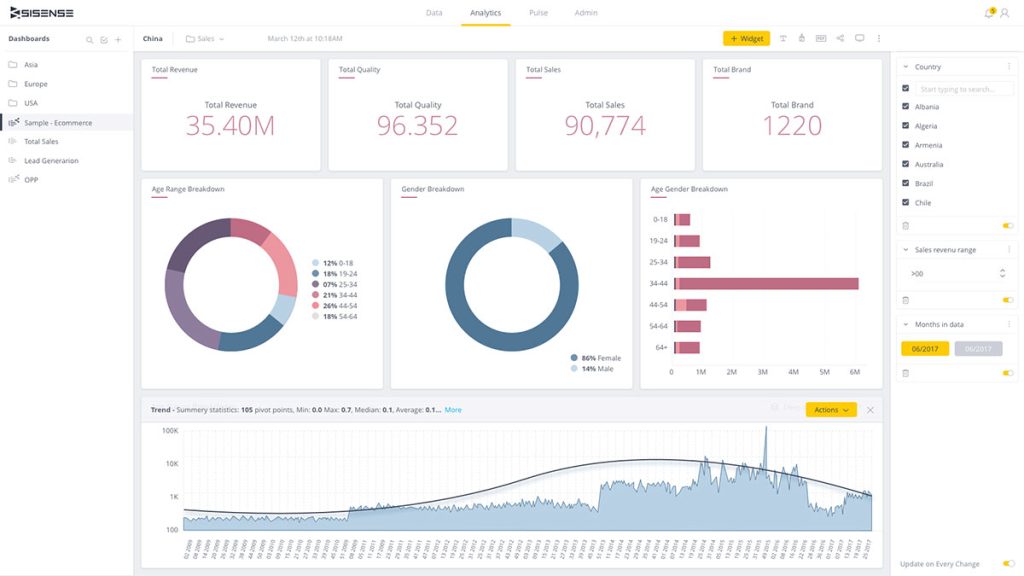
Sisense: Embedded Analytics for Developers
Sisense is an AI-driven BI platform known for its embeddable analytics toolkit. It provides a user-friendly dashboard builder with drag-and-drop widgets so business users can create custom reports and charts without coding.
Key Features:
- In-memory ElastiCube technology for fast, large-scale data processing.
- White-label APIs and SDKs to embed and customize analytics within applications.
- AI-powered insights offering automated recommendations and analysis across data sources.
Limitations:
- Requires Programming Knowledge: Advanced customization demands coding expertise, limiting ease for non-technical users.
- Steep Learning Curve: Some users report difficulty in onboarding and limited documentation support.
Verdict:
Sisense shines for embedded use cases but still relies on developers for deep customization.
In contrast, AskEnola embeds intelligence, not just dashboards, delivering natural-language insights inside any workflow without code, so product teams skip the engineering backlog.
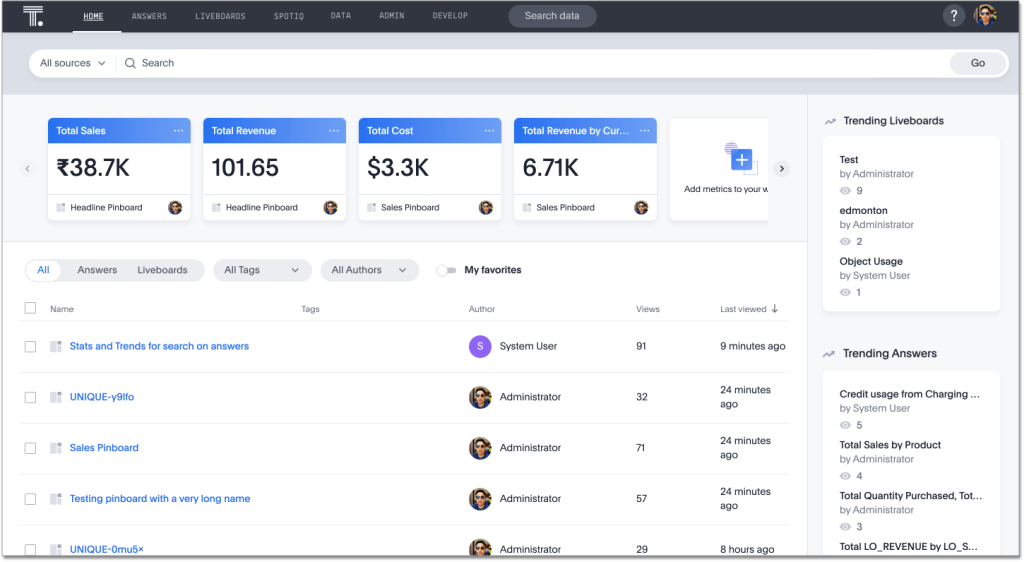
ThoughtSpot: Search-Driven Analytics with AI
ThoughtSpot is a search-based analytics tool built for data democratization. Instead of building dashboards, users simply type questions or keywords (like a Google search) into ThoughtSpot, which then generates visual answers using AI and machine learning.
Key Features:
- Natural Language Search: Users can ask questions in conversational English
- AI-Powered SpotIQ: Automated insights and anomaly detection
- In-Memory Computing: Fast query processing for large datasets
- Embedded Capabilities: APIs for integrating analytics into other applications.
Limitations:
- High entry cost: Consumption-based billing can become unpredictable and lead to higher overall expenses.
- In-memory model challenges: Organizations often need to adjust their data strategies to fit ThoughtSpot’s architecture.
- Not ideal for small teams: Licensing costs and overhead can be prohibitive for smaller organizations.
Verdict:
ThoughtSpot offers search, but at premium pricing and variable query costs.
AskEnola combines the simplicity of search with a fixed, transparent pricing model and enriches every answer with narrative recommendations, delivering enterprise‑grade insights without per‑question fees.
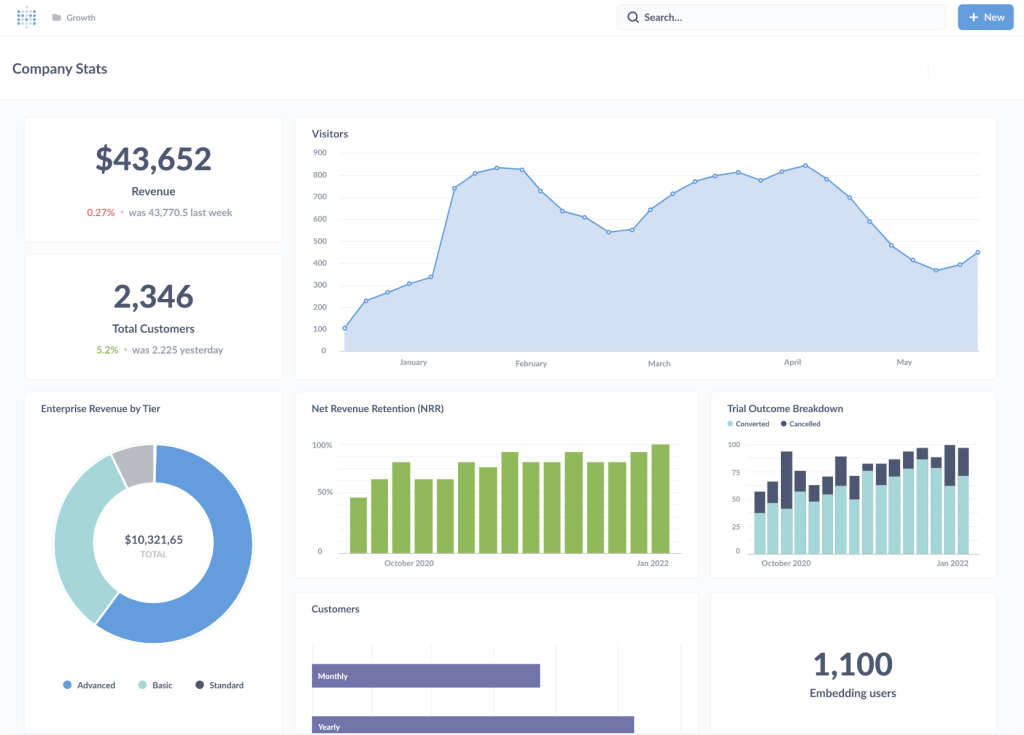
Metabase: Open-Source Alternative for Small Teams
Metabase is a lightweight, open-source BI tool that approaches business intelligence, making it attractive for budget-conscious organizations. It offers a web-based interface where users can create charts, dashboards, and SQL queries, but it also includes many GUI-driven shortcuts.
Key Features:
- Natural language querying lets both technical and non-technical users explore data without SQL.
- Open-source foundation with simple interface offering drag-and-drop queries and basic visualizations.
- Broad database connectivity supporting major SQL databases for flexible integrations.
Limitations:
- Requires SQL knowledge for advanced queries, lacking conversational or no-code capabilities.
- Limited AI and enterprise features, missing sophisticated insights compared to leading BI tools.
- Scalability and support challenges, relying on community forums and struggling with very large datasets.
Verdict:
Metabase is cost‑effective but lacks the AI guidance and narrative insights that advanced users expect.
AskEnola delivers advanced analytics with no SQL or plugins required, giving small teams enterprise‑grade answers in minutes.
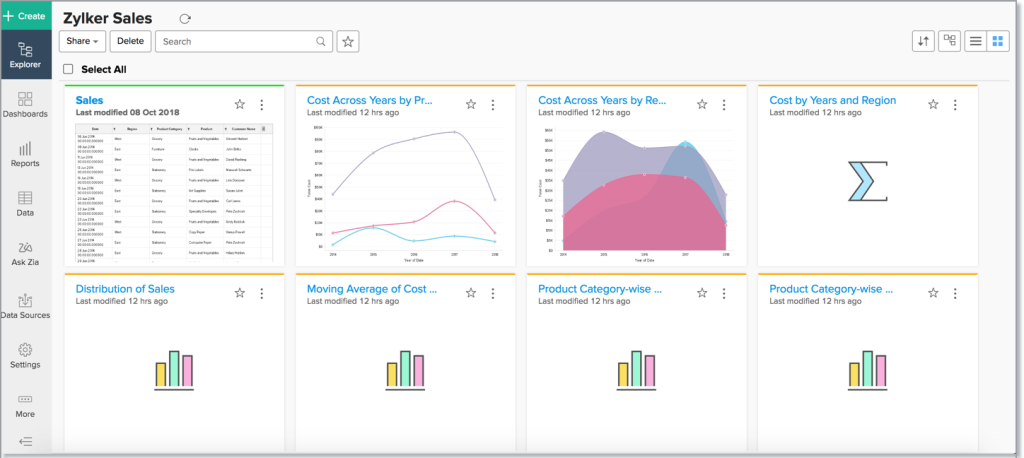
Zoho Analytics: All-in-One Business Intelligence (BI) Suite
Zoho Analytics provides a comprehensive BI solution with AI-powered features and extensive connectivity options. The platform targets small to medium-sized businesses with affordable pricing.
Key Features:
- Ask Zia AI Assistant for natural language queries and quick answers.
- Drag-and-drop interface enabling intuitive report building and dashboard creation.
- Affordable pricing tiers suitable for startups and growing organizations.
Limitations:
- Limited conversational capabilities compared to newer AI-driven platforms.
- Lacks deep AI analysis for complex or predictive insights.
- Dashboard-focused design rather than true conversational analytics.
Verdict:
In comparison, users appreciate Zoho’s all-in-one approach: it bundles dashboards, analytics, and even some predictive modeling in one package. Zoho Analytics is friendly and affordable, but still dashboard-first.
AskEnola eliminates dashboards, providing richer AI narratives and root-cause analysis without requiring users to build or maintain visual reports.
The Evolution Beyond Dashboards: Why No-Code or Low-Code Analytics Win
The shift away from traditional BI tools reflects a fundamental change in how organizations want to interact with data.
Dashboard fatigue is widespread, with studies showing that 30-40% of dashboards are abandoned within two months of deployment.
Modern businesses need conversational analytics that can:
- Answer questions instantly without dashboard navigation.
- Provide context-aware insights aligned with business goals.
- Eliminate analyst bottlenecks by enabling self-service for all users.
- Deliver executive-ready recommendations rather than raw data.
AskEnola leads this evolution by combining the analytical rigor of a senior data analyst with the accessibility of conversational AI.
While traditional tools focus on visualization, Enola focuses on enabling faster business decisions and transforms questions into actionable intelligence within minutes.
Choosing the Right Alternative
Every tool on this list brings its strengths.
Power BI syncs naturally with Microsoft workloads; Looker delivers developer-grade modeling; Sisense excels in embedded analytics; ThoughtSpot simplifies search; Metabase offers cost-free entry; and Zoho Analytics bundles BI at a budget price.
Yet each platform still inherits some flavor of dashboard dependence, coding overhead, or unpredictable costs.
AskEnola resolves these gaps by replacing dashboards with plain-language dialogue, automating analysis with BADIR™, and delivering narrative recommendations alongside real-time data.
She eliminates the need for dashboard creation and maintenance, instead providing instant, conversational insights that directly answer business questions.
Ask Enola costs 90% less than a regular analyst while delivering faster, higher-quality insights.
The result is sharp charts, concise summaries, and clear insights tailored to your role, delivered within minutes. Enola provides true self-service and no-code analytics, allowing anyone on your team to get decision-ready answers.
By design, Enola simplifies complex analyses so everyone can make data-driven decisions.
Get your free demo today or explore our Sandbox to see Enola in action.
FAQs:
What are the best Tableau alternatives for non-technical users?
The best Tableau alternatives for non-technical users are conversational and no-code analytics platforms that don’t require SQL, drag-and-drop dashboard building, or analyst support. Tools like AskEnola, ThoughtSpot, and Domo offer varying levels of self-service capability. For business users who want to ask questions in plain English and get immediate answers without building charts, AI-native platforms designed for natural language queries are the strongest alternative to Tableau’s visualization-heavy model.
Why are businesses moving away from Tableau?
Businesses are moving away from Tableau primarily because of its steep learning curve, high analyst dependency, and dashboard-centric approach. Tableau is built for data professionals, not business decision-makers. When questions change, dashboards need to be rebuilt — creating a constant backlog for data teams. Modern teams need tools that answer ad-hoc questions instantly without requiring a new dashboard for every new query.
What is no-code analytics and how does it work?
No-code analytics is a data analysis approach where business users interact with their data through natural language questions or simple interfaces, without writing SQL or configuring dashboards. Under the hood, the platform automatically generates queries, runs analysis, and returns answers in plain English or visual summaries. No-code analytics tools connect directly to data warehouses like Snowflake, BigQuery, or Redshift and handle all technical processing invisibly.
How does conversational analytics compare to traditional BI dashboards?
Conversational analytics differs from traditional BI dashboards in three fundamental ways: interaction model, speed, and flexibility. Dashboards require users to know which metrics to look at in advance and are static — they show what was built. Conversational analytics lets users ask any question in natural language and receive a direct, data-grounded answer in seconds. For ad-hoc questions, sudden anomalies, or executive briefings, conversational analytics is significantly faster and more flexible than dashboard maintenance.
Can small or mid-sized businesses afford Tableau alternatives?
Yes — many Tableau alternatives are designed specifically for small and mid-sized businesses and are priced more accessibly than Tableau’s enterprise tiers. No-code AI analytics platforms often charge per user rather than by data volume or server infrastructure. More importantly, SMBs typically save significantly on analyst headcount when non-technical team members can answer their own data questions without submitting requests to a data team.
What is AskEnola, and how does its no-code interface simplify analytics?
AskEnola is a conversational analytics platform and one of the leading Tableau alternatives, making Business Intelligence accessible to everyone.
With no code required, Enola allows any user to ask data questions in plain English and instantly receive insights from your data warehouse (Snowflake, BigQuery, Redshift, Azure Synapse, and more).
She is your AI “Super-Analyst” who instantly translates your query into live database analysis and delivers narrative, role-tailored insights.
This true no-code experience means anyone on your team can explore data and get answers in minutes.
Learn more how Enola turn your data into actionable insights.
How does AskEnola deliver self-service analytics without SQL?
AskEnola eliminates the need for traditional dashboards and manual queries. Behind the scenes, Enola, your AI Super-Analyst, auto-generates SQL, so users never have to write a single line of code.
Just ask questions like “What drove last quarter’s revenue change?” and receive narrative answers along with visuals. The platform handles all SQL operations in the background.
Business users simply ask and get insights. No SQL required.
Try it yourself in the AskEnola Sandbox.
How do I get started with AskEnola’s no-code and self-service analytics platform?
Onboarding AskEnola is quick and easy for any business user. Simply connect your data warehouse via OAuth and grant secure access. No developers or lengthy setup calls are needed.
Enola, your AI Super-Analyst, automatically scans your schema and is ready to answer questions in minutes. Just start asking business questions in natural language to get instant answers.
Request your free demo today!!
Can AskEnola handle low-code/no-code and low-maintenance analytics at scale?
Yes.
In our comparison of Tableau alternatives, AskEnola’s low-code architecture scales effortlessly from small teams to enterprise deployments.
With direct, real-time connections to cloud data warehouses like Snowflake, BigQuery, and Redshift, AskEnola eliminates manual modeling and stale data, reducing dashboard fatigue and maintenance overhead by replacing dashboards and tickets.
How does AskEnola’s BADIR methodology provide conversational analysis?
As detailed in the blog, BADIR™ (Business question, Analysis plan, Data collection, Insights, Recommendations) ensures every AI-driven answer is accurate and actionable. This methodology replaces static dashboards with narrative guidance tailored to your role.
BADIR™ replaces fragmented dashboards with contextual follow-up queries and decision-ready insights tailored to your role.
Discover the framework on our BADIR™ Powered Intelligence page.
Can AskEnola handle enterprise-scale data and reduce maintenance effort?
Yes.
AskEnola connects directly to modern cloud data warehouses (Snowflake, BigQuery, Redshift, etc.) and pushes computation to the cloud.
There is no data modeling or ETL to maintain. Enola scans your metadata and builds a semantic layer automatically. As a result, teams avoid the usual dashboard upkeep while still receiving up-to-date insights at any scale.
Explore more capabilities on our product page.
What ROI can we expect by switching to AskEnola compared to traditional dashboards?
Real-world users report cutting analysis costs by up to 90 percent and getting insights 10 times faster than analyst-dependent workflows. By eliminating dashboard development and maintenance, teams free up time and budget for strategic work.
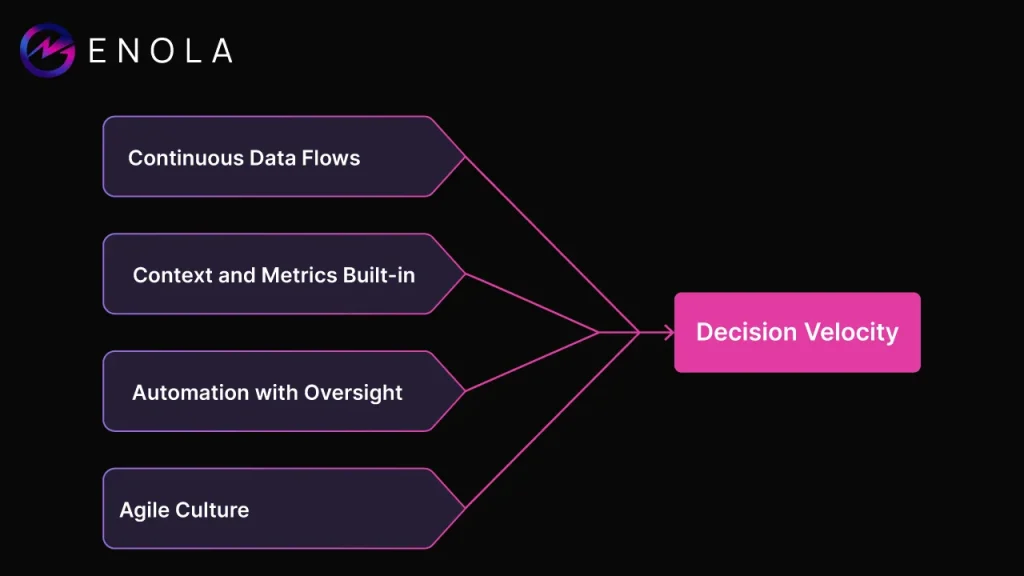
In short, AskEnola speeds up decision-making from weeks to minutes, reduces BI overhead, and prioritizes Decision Velocity to enable real-time decisions.
Explore the ROI calculator to estimate your time and cost savings.
How does AskEnola ensure accurate, decision-ready answers without AI “hallucinations”?
AskEnola is built on Aryng’s BADIR™ methodology (Business question, Analysis plan, Data collection, Insights, Recommendations), a proven framework for reliable analytics.
Enola, your AI Super-Analyst, only reports findings backed by your live data warehouse, not assumptions or guesswork.
Every answer is validated through a structured process, with automatic enforcement of row-level security and compliance. This business-driven, hypothesis-first approach delivers guaranteed actionable results with enterprise-grade trust.
Discover the Enola’s foundational framework on our BADIR™ page.
Related Blog: