Informed business decisions have always relied on analytics, and therefore, also on data visualization. With the increase in data volumes and complexity of analysis, the limits of traditional tools are being reached. Today, companies require systems not just to show the information but also to interpret it. It’s no surprise that the use of AI tools for data visualization is coming to the fore by reshaping analytics and business intelligence.
Table of Contents
- The Evolution of Data Visualization
- How AI Enhances Data Visualization
- AI Data Analytics Tools: Connecting Analysis and Insight
- From Static Reports to AI-Powered Dashboards
- Choosing the Right AI Tools for Visualization and Analytics
- The Growing Role of AI in Business Intelligence
- The Future of Artificial Intelligence Visualization
The future expected by 2025 no longer sees data only in terms of charts or reports. It sees data as the ability to clarify, speed up, and automate the process. The artificial intelligence visualization, for example, first allows analysts to uncover insights faster, then to identify relationships among datasets, and lastly to predict possible outcomes with great precision. The blending of visualization and AI is making it possible for the decision to be based not only on the past trends but also on predictive forecasts.
Let’s explore how AI-powered dashboards and AI business intelligence tools are redefining the way professionals analyze and act on data in the coming year 2026.
The Evolution of Data Visualization
Initially, dashboards used to consume a lot of time and effort. Analysts were responsible for collecting the data, making the charts, and manually factoring in the information in the reports. Early dashboards only showed what had already happened during a given period.
With the advent of coping with larger data volumes by businesses, the need for automation became apparent. Notably, modern AI data analytics tools have what it takes to render real-time visualizations, detect anomalies, and suggest key metrics automatically
AI-driven visualization systems, unlike their static counterparts, internally model user’s preferences and adjust accordingly. They are moving from basic depiction to intelligent explanation.
How AI Enhances Data Visualization
Artificial intelligence has been incorporated into the visualization process, bringing along its complexity and diversity. The previous method of data visualization that relied entirely on predefined templates has been rendered obsolete. To the contrary, AI software for data representation is now generated by thoroughly and instantly producing charts and images that tell the same story as the data.
This is how AI improves data visualization:
- Automated Data Preparation: AI automates data cleaning and merging, minimizing human effort.
- Smart Visualization Selection: The algorithms are suggesting the visuals according to the data type and pattern.
- Anomaly Detection: AI analytics tools highlight unusual data points for further review.
- Predictive Visualization: The models are showing the trends that have been forecasted visually.
AI Data Analytics Tools: Connecting Analysis and Insight
A coherent analysis can be made only if it is backed up by strong analytics. AI data analytics tools have great technical power along with an easy-to-understand data visualization. It is by means of machine learning, statistical models, and natural language processing that analysis is made easier for non-technical users.
AI-enabled users can:
- Detect hidden relationships between massive datasets.
- Realize performance issues or malpractice risks instantly.
- Predict the next possible outcomes based on previous data.
- Get escalating clarification messages commensurate with the meaning of the data.
These tools make the task of demystifying the gap between technical analysis and business strategy easier; therefore, the presentation of every visual is supported by substantial interpretation.
From Static Reports to AI-Powered Dashboards
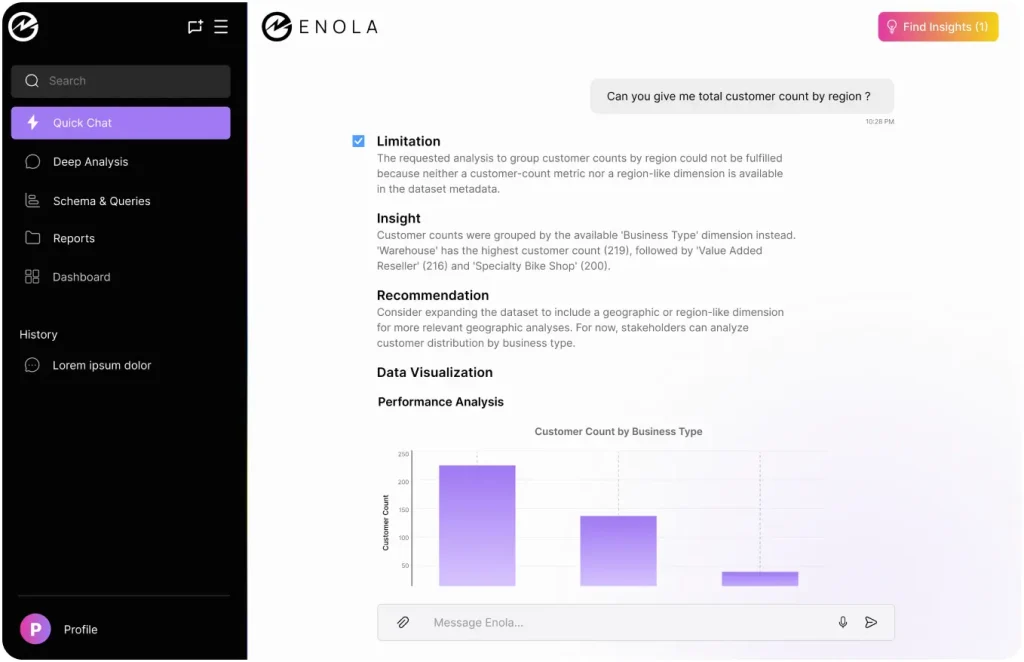
AI-powered dashboards are the future of analytics. They have the characteristics of being dynamic, adaptive, and conversational. Instead of waiting for the scheduled reports, the users can ask questions in natural language and get a visual representation of the insights they are looking for instantaneously.
- The modern AI dashboards are designed to:
- Customize the views according to the role or purpose.
- refresh automatically when new data enters the system,
- notify when the metrics deviate from the anticipated patterns.
- Advice on the next possible actions based on predictive analysis.
The collaboration of automation and intelligence in these dashboards makes the process of data-driven decision-making faster and more intuitive.
Choosing the Right AI Tools for Visualization and Analytics
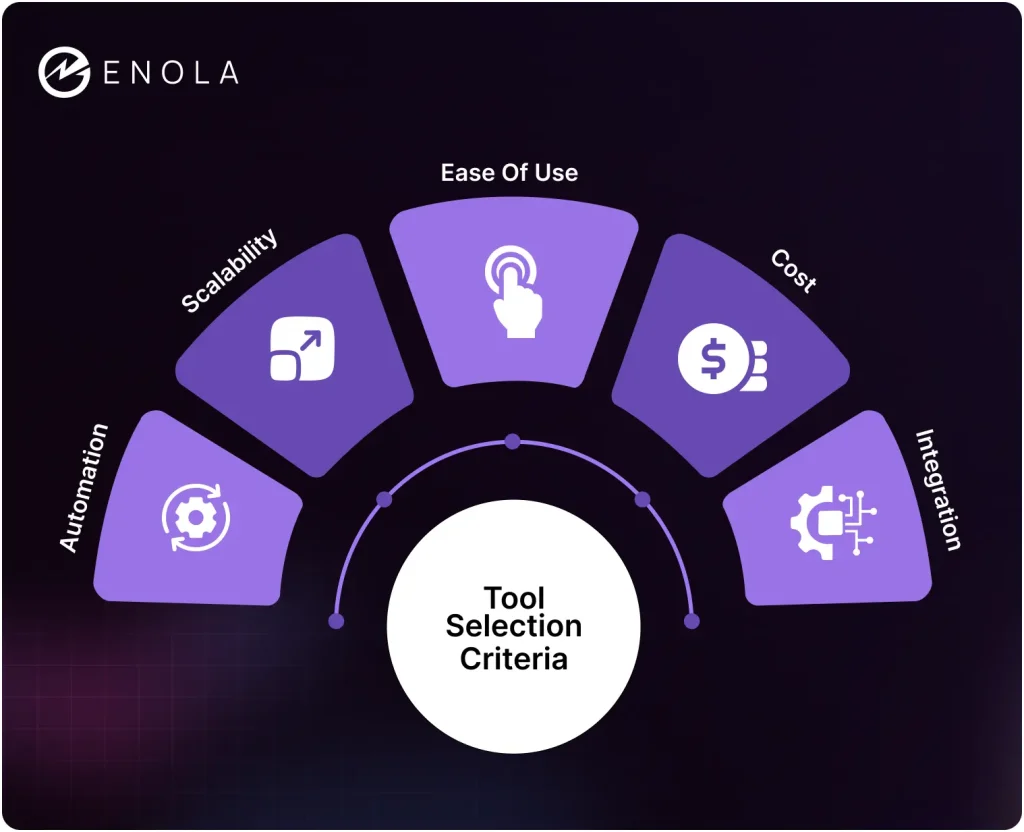
The selection of appropriate AI tools for data visualization is contingent upon the trade-off between functionality and simplicity. The depth of automation and integration of the tools is not similar across the board. In evaluating the platforms, the following should be considered:
- Ease of Use: Choose systems that offer natural language queries and no-code environments as a feature.
- Integration: It is necessary to check that the enterprise data warehouses, such as Snowflake or BigQuery, are supported.
- Scalability: The applications must be capable of increasing data volume without losing performance.
- Security: Encryption and privacy compliance at an enterprise level are required.
- Automation: The top solutions are the ones that recognize the underlying insights proactively without making any manual input.
What is desired is the discovery of solutions that are powerful in analytics and easy to use at the same time, so that the data is no longer the sole concern of the analysts or business leaders.
The Growing Role of AI in Business Intelligence
The emergence of AI-assisted business intelligence tools marks a radical transformation in the data processing practices of businesses. AI is no longer merely an assistant for the analysis but a principal actor. With the help of BI powered by machine learning, the systems comprehend the surroundings, mark the critical insights, and train themselves through user interaction.
For market analysts, it means that they will spend less time on data manipulation and more on strategy. AI doesn’t just assist analysis; it automatically surfaces insights for analysts. The tools grow smarter with each query, thus accuracy and relevance get enhanced with each conversation.
What you end up with is an intelligence process that is business-oriented and is faster, smarter, and, above all, continuously improving.
The Future of Artificial Intelligence Visualization
By the end of 2025, AI-based visualization will have progressed from being an automatic process to being one that anticipates the outcome. The next wave of systems will not only be able to respond to questions but also be able to foresee the questions, providing the insights even before users ask.
Besides, the AI data analysis instruments will also become more interactive. It will enable the teams to comment and mark the visual insights even while being inside the dashboard. Hence, the barrier between the discovery and the decision is effectively minimized.
Analytics in 2026 will merge context, prediction, and automation. The process of visualization will not be defining the past anymore, but it will be allowing the users to steer through the future.
As of 2025, it is clear that smart visualization has permeated modern analytics. Companies that embrace AI for data visualization are not merely increasing their productivity but are completely restructuring their decision-making processes.
AI-enabled dashboards and advanced AI business intelligence applications merge in such a way that the result is a blend of speed, accuracy, and clarity, which makes it possible for the data to unfold stories that direct instantaneous actions. Organizations can convert data into a positive effect faster than ever by combining the breadth of analytics with the user-friendliness of visualization.
In 2026, AI will not just enhance data visualization but transform it completely. The analytics of the future will be of the systems that think, learn, and visualize with the humans that use them.
Related Blog: