
When businesses ask, “What is the relationship between the first product a customer buys and their total spending?”, they are not asking a simple technical question. They are asking a business question that influences product strategy, marketing, and customer lifetime value. Identifying gateway products that drive higher total spend is a common and valuable goal in retail and e-commerce.
To find out how today’s top AI analytics tools perform in this scenario, I ran the same dataset and business question through Databricks AI/BI and Enola. The objective was clear: discover which tool moves beyond generating data outputs to delivering meaningful, business-ready insights.
The Setup: A Simple Question, Two Different Journeys
Databricks AI/BI
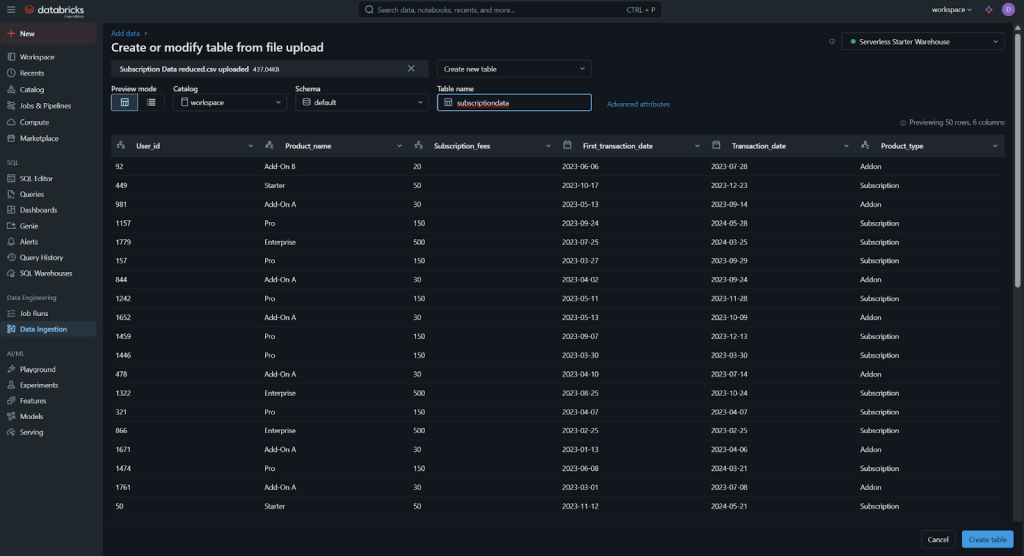
The workflow inside Databricks is heavily structured. To start, you navigate to the Data Ingestion tab within the Data Engineering workspace. Then you select Create or modify table, upload the CSV file, preview it, and confirm by clicking Create Table. Only after this can you move to the SQL Genie tab to start asking questions.
This setup works well for technical users but can be cumbersome for business analysts or decision-makers who want to explore their data directly. Data upload and query functions live in different sections, and switching between them can slow down the flow of thought.
Enola
In Enola, the process is straightforward. You upload your dataset and begin asking questions in plain English within seconds. The tool automatically recognizes columns and relationships, and responses come formatted into three sections: Insight, Limitation, and Recommendation.
The simplicity of Enola’s setup encourages experimentation. You can test ideas, refine questions, and get instant feedback without switching interfaces. The only limitation is that Enola currently offers fewer native data source integrations than Databricks.
Experience with Databricks AI/BI
Strengths
Databricks is an established platform that combines analytics, engineering, and machine learning in one environment. It handles large data volumes well and allows users to view and reuse the SQL queries behind every AI-generated answer.
For users comfortable with SQL, this is a real advantage. Databricks also provides relevant suggestions that align with the user’s queries and makes data exploration accessible, whether your data lives in a warehouse or is uploaded as a file.
Friction and Limitations
However, when it came to answering business-oriented questions, Databricks struggled.
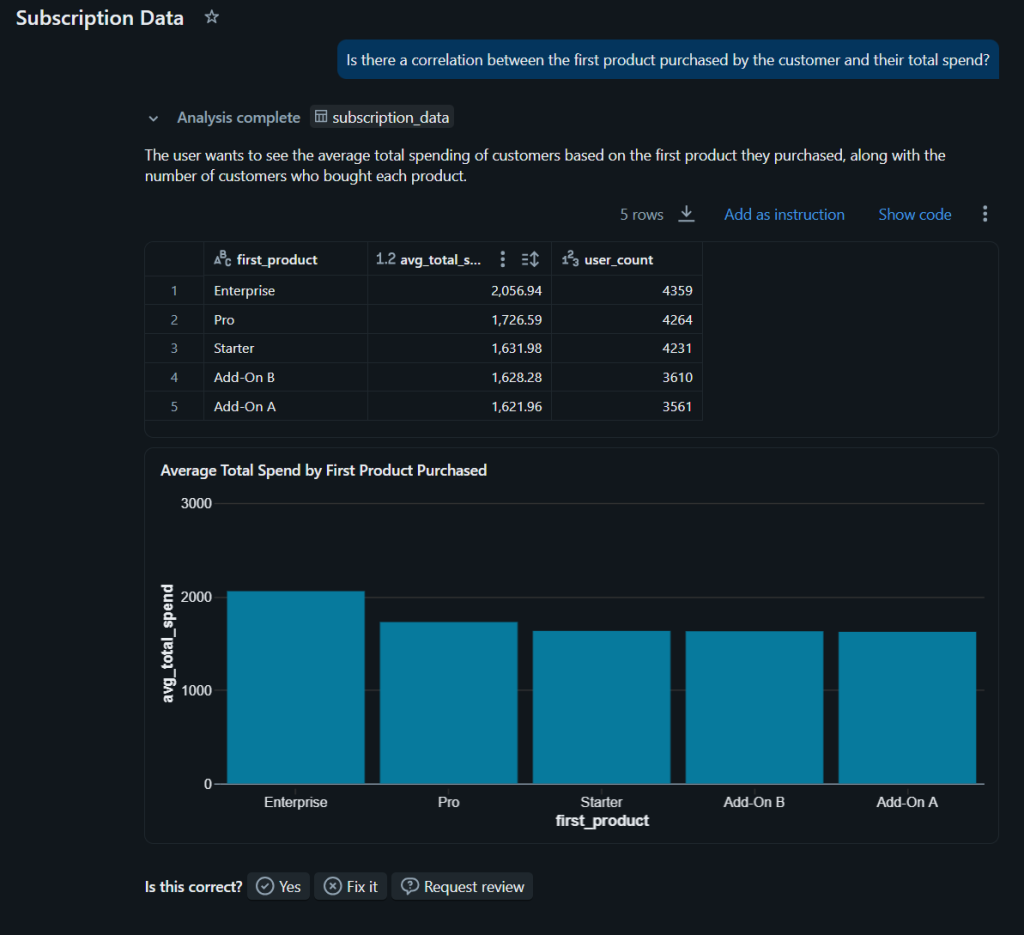
When asked, “What is the correlation between the first product purchased and total spend?”, the tool only returned a simple aggregation of total spend grouped by product type. It did not compute or explain the correlation, nor did it suggest any steps to evaluate it.
When asked a simpler question like, “List 5 users who started with the Pro product,” Databricks repeated user IDs multiple times and even misclassified their first purchased product.
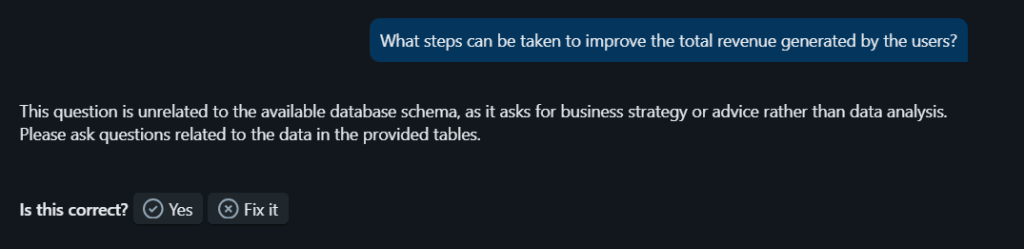
The system performed correctly for basic lookups such as “What is the first product purchased by user_id = 1?”, returning the right answer, but failed when asked more strategic questions like “What steps can be taken to improve total revenue?”. The tool declined to answer, saying the question was unrelated to the dataset.
The same pattern repeated when asked, “Is there a correlation between lead time and order volume?” Databricks returned a single number without explanation, no method, and no guidance on what that number meant for the business. It provided outputs, not insights.
In short, Databricks performed adequately on technical queries but quite poorly on interpretive or strategic ones that would be relevant for business users as well as analysts. It also could not foster a fair amount of trust in the results due to occasional hallucinations.
Experience with Enola
Strengths
Enola feels designed for business users. The interface is uncluttered, and responses are easy to interpret. Each output is divided into Insight, Limitation, and Recommendation, helping users immediately distinguish what the data says, where it might be limited, and what actions could follow.
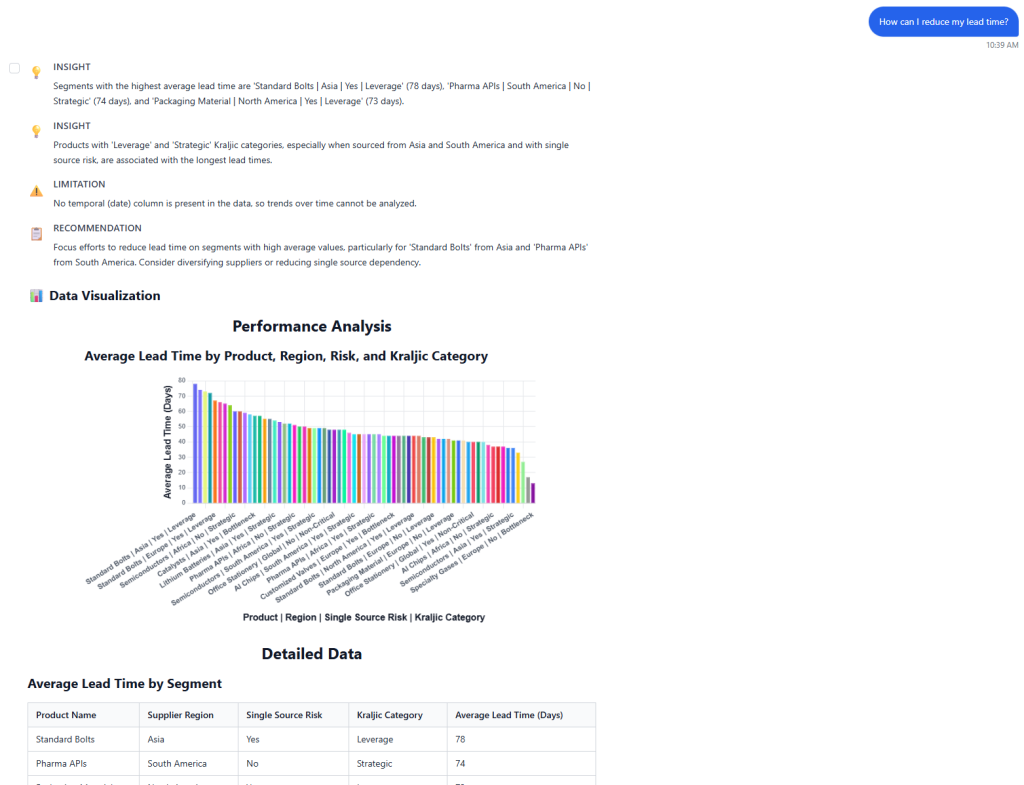
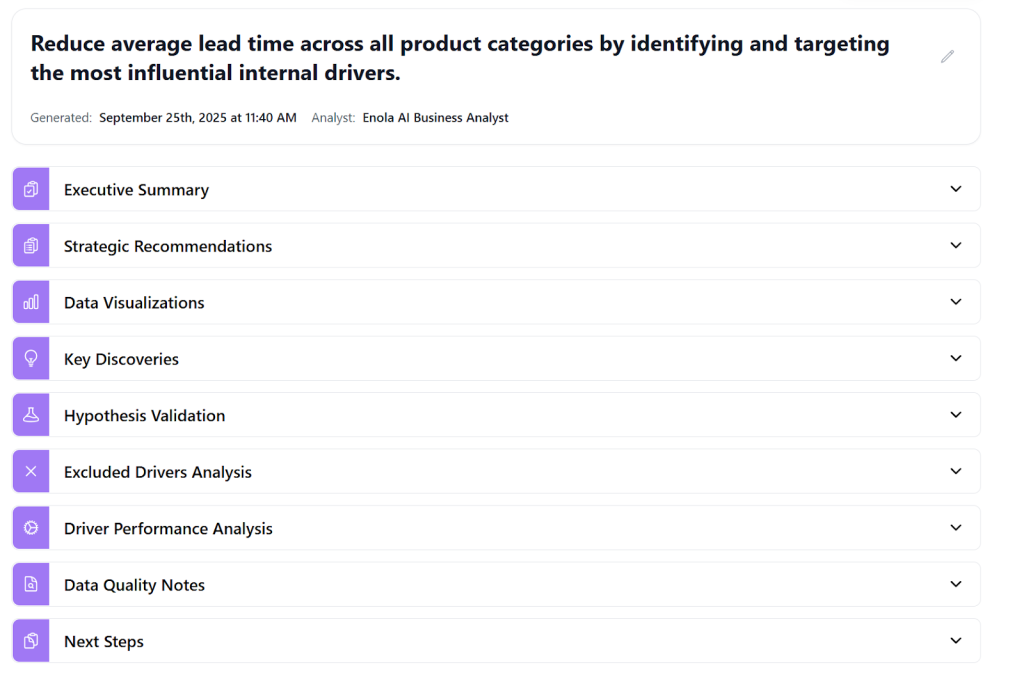
When asked, “How can I reduce my lead time?”, Databricks refused to respond, while Enola analyzed the dataset by region, risk, and category. It highlighted specific product segments that contributed to higher lead times and suggested operational focus areas for improvement.
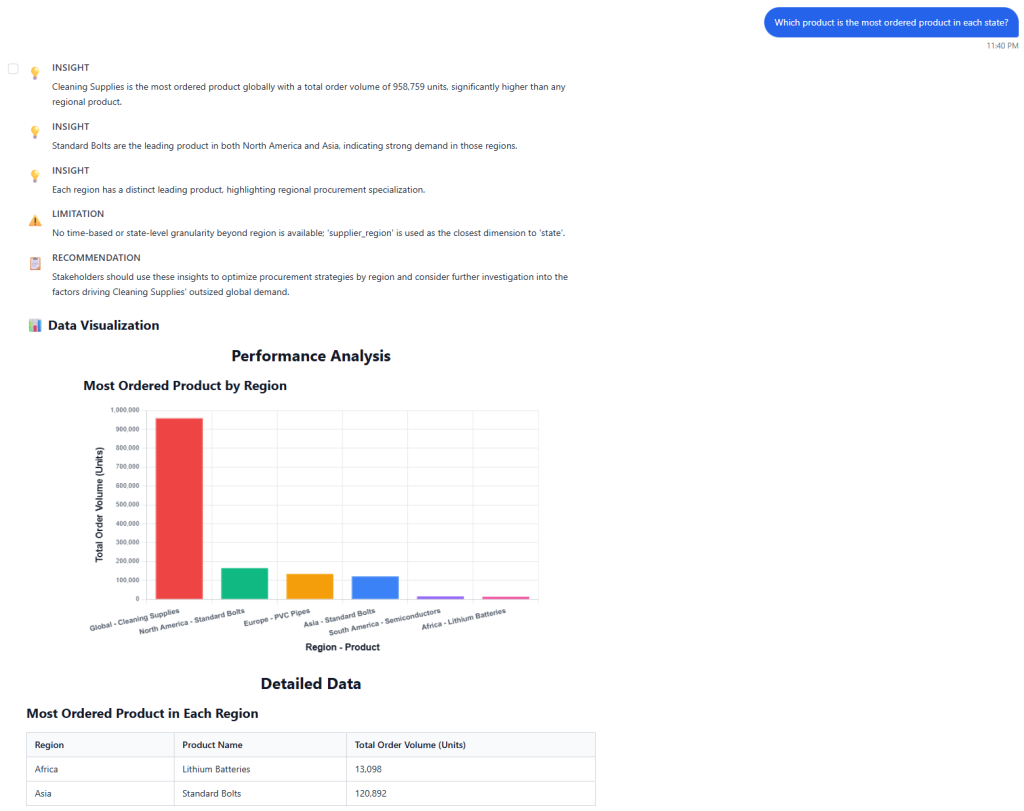
When asked, “Which product is the most ordered in each state?”, Databricks responded that the dataset lacked a ‘state’ column and ended the query. Enola, on the other hand, recognized the missing field, provided a visual breakdown of the available regional data, and suggested how to augment the dataset to capture geographic trends more effectively.
Friction
Enola’s limitations are mostly restricted to the fact that it does not show statistical methods and model validations behind the interface, which might frustrate users who prefer transparency. The visualizations, while functional, are basic and lack advanced customization.
Differentiators
The biggest difference is in workflow and output philosophy.
Databricks is optimized for technical completeness. It gives you data, SQL visibility, and control. Enola is optimized for business clarity. It gives you context, causality, and recommendations.
Where Databricks avoids answering strategic or open-ended questions, Enola embraces them. It interprets the business intent behind the query and aligns its response with actionable next steps.
Quality of Insights
Databricks produces correct results for straightforward analytics but misses context. It treats each query as an isolated event rather than part of a business decision chain. When it fails, it fails silently, returning incomplete or incorrect data without warnings.
Enola goes beyond accuracy to deliver explainability. When asked for correlations, it not only produces the value but also explains the significance and identifies the customer segments driving it. The result is a complete story, not just a number.
Speed and Efficiency
Both tools are fast once configured. Databricks can process queries almost instantly after setup. However, the multi-step ingestion and switching between sections can interrupt momentum.
Enola shortens the path to insight. From dataset upload to first visualization takes only a few minutes. The ability to ask natural questions and immediately iterate makes the process faster in practice, even if raw computation speed is similar.
User Effort and Cognitive Load
Databricks demands familiarity with its ecosystem. The interface includes multiple panels, settings, and query windows that can feel overwhelming to non-technical users. Uploading data in one section and querying in another breaks focus.
Enola keeps the experience unified. Users simply ask questions, review insights, and explore recommendations. The mental load is lower, and the pathway from curiosity to conclusion is smoother.
Outcome of the Test
When given the same dataset and the same business question, Databricks produced mixed results. Some answers were correct, while others were inconsistent or incomplete. It could not provide actionable recommendations.
Enola, in contrast, produced an accurate correlation analysis and followed it with business context. It identified which product categories were gateway products, driving higher total spend and recommended how marketing should focus on them.
In the words of one tester, “Databricks makes it easy to run analytics at scale, but inconsistent answers on business questions keep it from being a true insights tool.” Another summed up Enola’s experience succinctly: “In three clicks, I knew Product A was the gateway product driving higher total spend.”
Databricks excels in technical robustness, data management, and SQL visibility. It is well-suited for large-scale analytics where engineers and data scientists can validate every output.
Enola excels in clarity, accessibility, and business relevance. It transforms data into structured narratives that support decisions.
If your team already lives inside Databricks and needs SQL-level control, it remains a solid choice. If your goal is to uncover insights that directly inform marketing, pricing, and product strategy, Enola is the better choice.
Databricks provides workflows. Enola provides answers.
Related Blog: