I spent the past week running the same supply chain use case through two very different tools. The use-case for analysis was simple on the surface: how can we reduce the lead time for procurement? The impact of this question is anything but simple, of course. Shorter lead times mean less capital trapped in safety stock, fewer surprises in the supply chain, faster response to market demand, and happier customers at the end of the chain.
To keep the test fair, I used the same CSV, asked the same questions, and resisted the urge to tweak or babysit either tool. What follows is a first-person look at how ThoughtSpot and Enola behave when you push them beyond surface-level reporting and ask for real analytical help. If you have been trying to understand what a true AI analyst should feel like, or searching for ThoughtSpot alternatives, this breakdown will help.
Setting Up Both Tools
ThoughtSpot’s First Impression
I expected the setup to be smooth since ThoughtSpot is widely known for its search-based analytics experience. However, while it was not hard, yet it was not guided either. The onboarding screen shows a sample dataset front and center, which draws you in. The real data upload option sits quietly behind the Datasource section, tucked under a small plus icon. Nothing broken here, only small frictions that slow new users down.

Enola’s Setup Experience
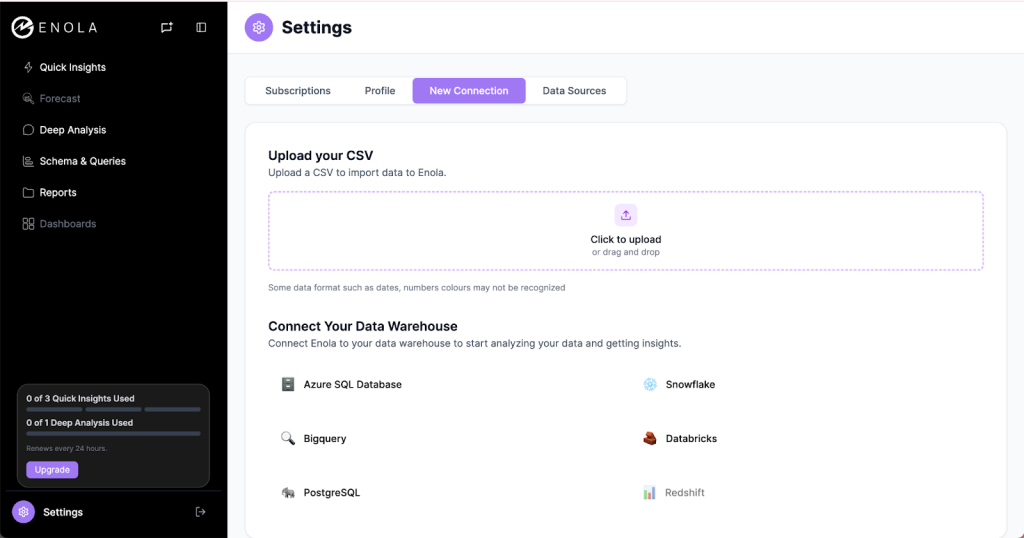
Enola keeps the setup process short. Upload a CSV or connect a warehouse like BigQuery, Snowflake, or Databricks. Then ask questions in plain English. That is the entire onboarding. I found myself moving to the real task faster because there were just the right choices to make, and fewer places to get lost.
First Round: Asking the Core Question
My test question was the same for both tools. How can we reduce the lead time for procurement?
ThoughtSpot’s Output
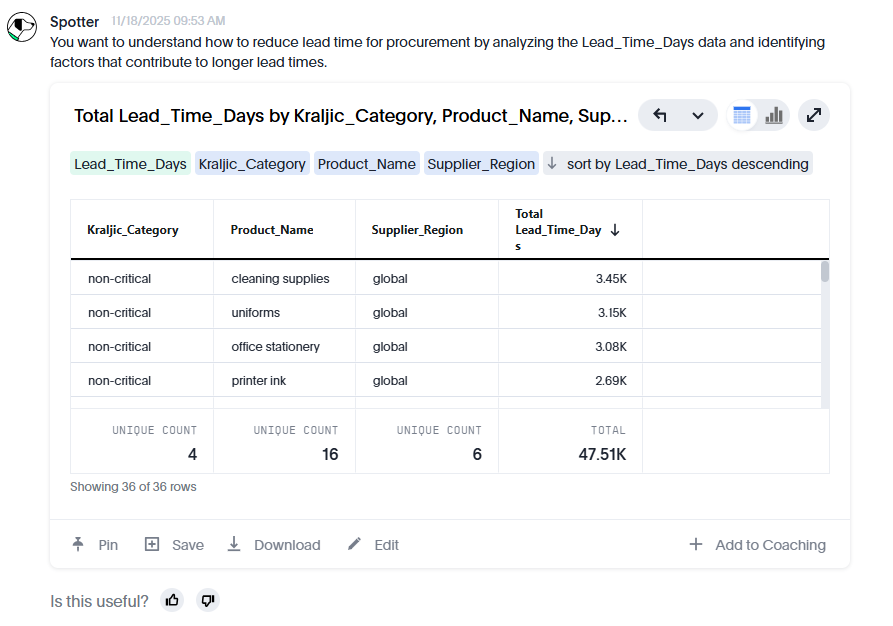
ThoughtSpot returned a table that showed aggregated lead time across categories. It was clean and accurate, although it stopped at the data. No interpretation. No explanation of what was driving delays. No direction for where to look next.
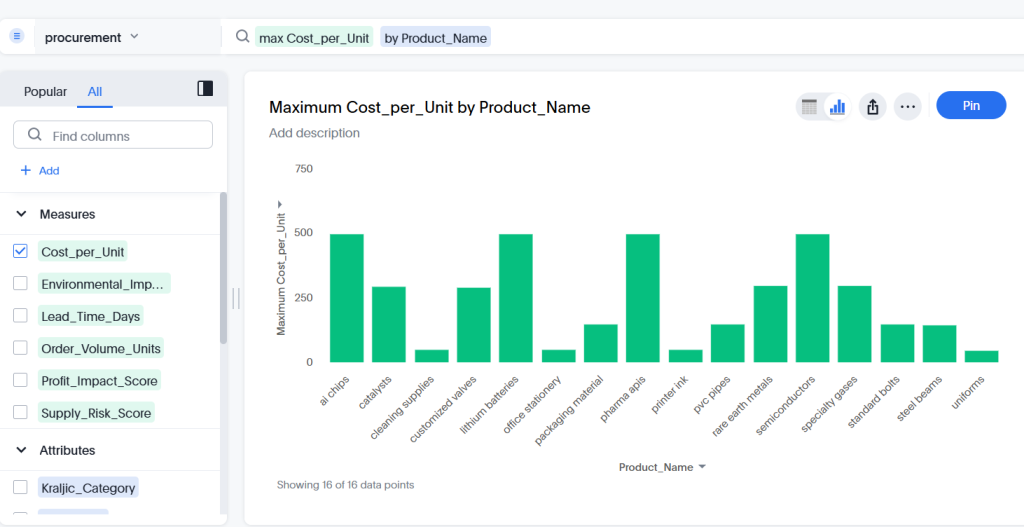
When I asked for the average lead time by supplier region, the system gave me a neat and valid chart within seconds.
ThoughtSpot shines when the task is slicing data or customizing visuals. I changed attributes, swapped chart types, and pinned results onto a Liveboard without effort.The challenge is that none of these charts helped me understand why lead times were high or what to do about it. ThoughtSpot excels as a top tier explorer. But, it is not a thinker, and takes none of the cognitive load.
For deeper analysis, I still had to manually examine patterns and figure out what mattered. The SpotIQ Analyser was helpful for spotting outliers, although it surfaced them without context. I knew what stood out, not why it mattered.
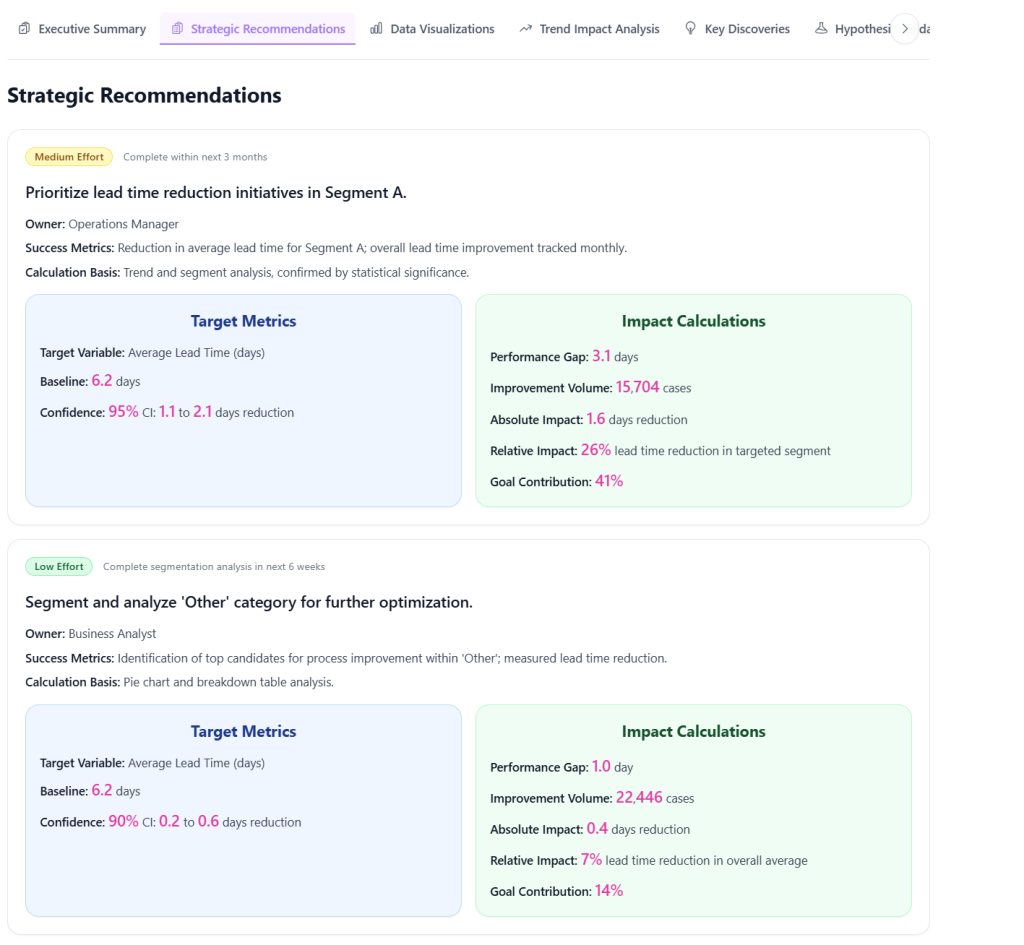
Enola’s Output
My first question to Enola resulted in a structured answer grouped under Insights, Limitations, and Recommendations.
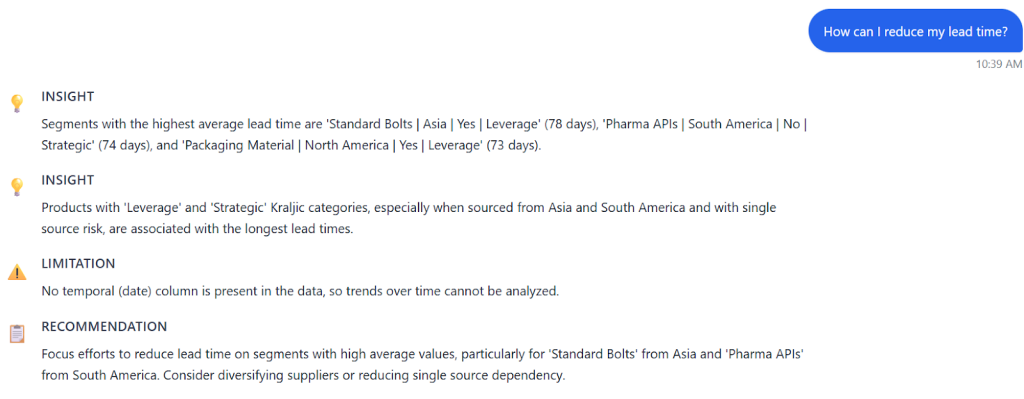
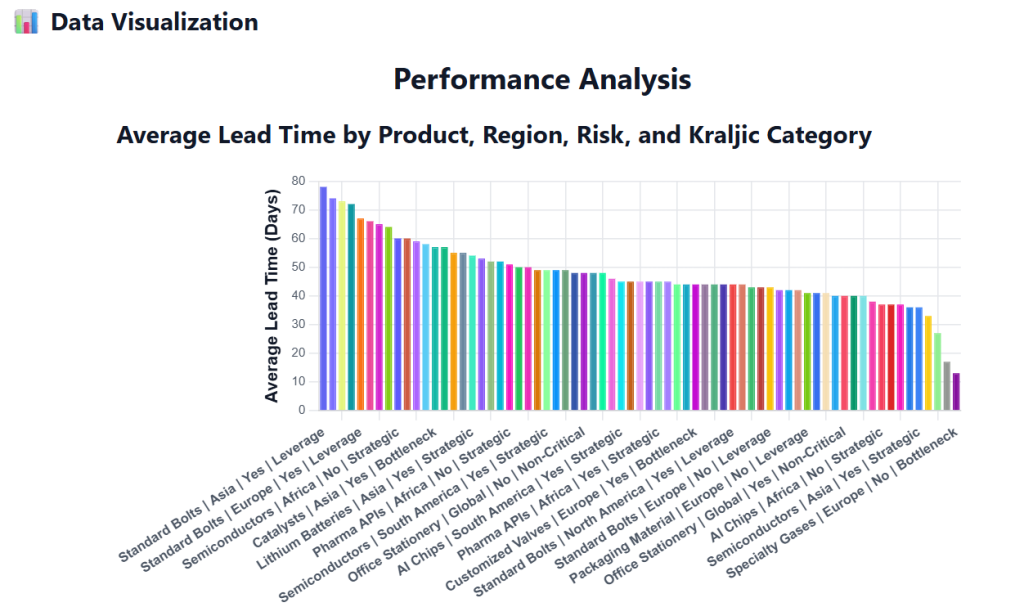
It was immediately clear what was driving long lead times and which combinations of region, risk level, and product category had the biggest delays. The single visualization it generated was simple and direct. It was not a gallery of chart options, but it did not need to be. The picture told me exactly where the problem lived.
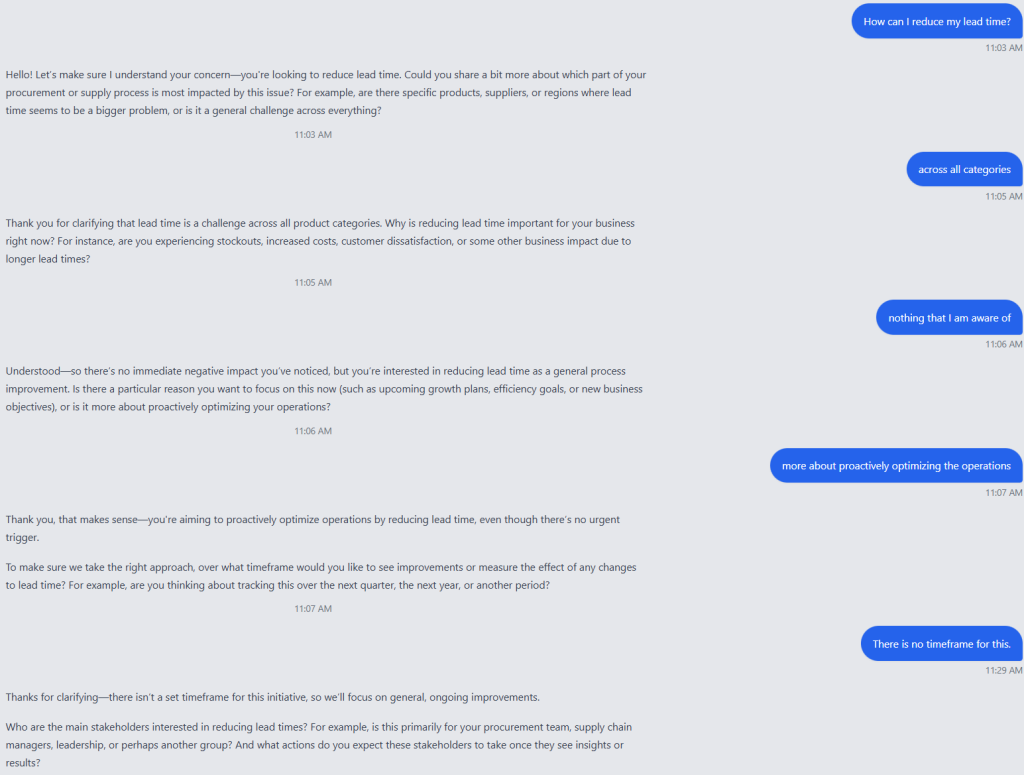
For the same question, I then turned on Deep Analysis. The tone shifted from answering to collaborating. Enola asked clarifying questions. Which product category matters most? What timeframe is relevant? Should negative trends be included? Who will be making a decision based on this analysis? It was validating the problem in real time, almost like a junior analyst thinking aloud before diving into the data.
After this short interaction, it produced hypotheses for reducing lead time and a structured analysis plan.
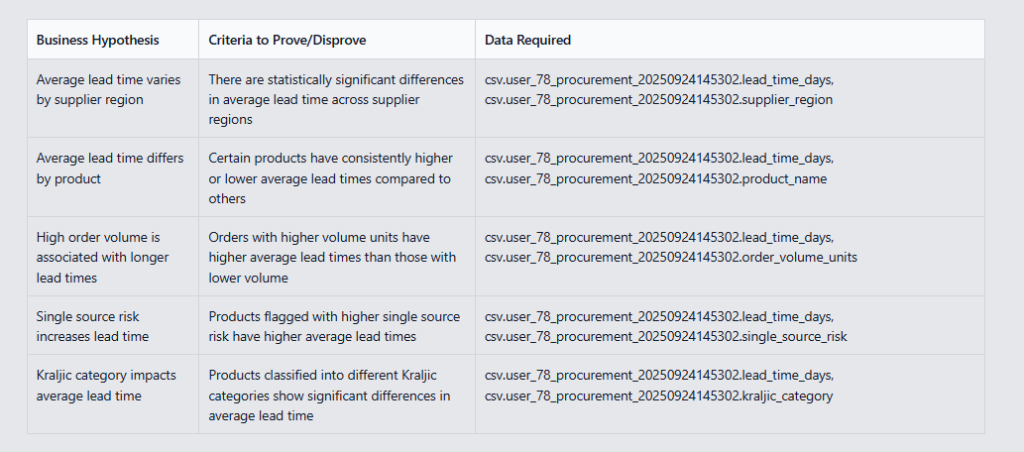
The plan included the tests it would run, the factors it would examine, and the expected output. I could accept, delete, or add hypotheses. This was far more than a surface-level interpretation. It was an assistant who understood the business question and shaped the work accordingly. In a single view, I could see the regions and product categories driving the longest lead times. Simple and actionable.
Quality of Insights
ThoughtSpot
Great for clean charts and fast data exploration. Not ideal for complex decisions that depend on context or deeper analysis. The visuals are strong. The insights are up to the user, and there is no support for deep analysis that can help identify root causes, drivers, etc.
Enola
Strong for clear, structured insights. It offers fewer visualization options, yet the analysis itself is richer and more decision-ready. It interprets the patterns for you and goes deeper when asked. It takes on cognitive load from the user, and becomes not just a co-analyst, but also a true decision partner that can deliver real impact.
Speed and Efficiency
ThoughtSpot
It is fast when you know what you want to slice or visualize.
The challenge comes when the question is less about data and more about decision making. That is where speed becomes deceptive. You get fast outputs, sure, but you still have to work through the interpretation on your own.
Enola
It answers quickly and in a structured format that reduces interpretation time. Deep Analysis speeds things up even more by narrowing the problem before running the work.
Even though some of the individual responses took longer, I found the overall time-to-insight (and time-to-decision as well) shorter than with ThoughtSpot.
User Effort and Cognitive Load
ThoughtSpot
Moderate effort. You need to know where data lives, understand the search UI, and interpret patterns yourself. It rewards analysts who enjoy data exploration and can quickly form mental models from charts.
Enola
Low cognitive load for business users and moderate for analysts. You get immediate clarity, although analysts who want statistical work must steer it a bit. The upside is that the tool tries to understand your goal rather than treat everything as a charting request.
Who Wins for This Use Case?
ThoughtSpot is a good option when the goal is visual exploration and when the user has the analytical background to interpret data independently. If you need to slice data across dozens of attributes and build custom dashboards, it is the right tool. In these cases, it is a top contender among ThoughtSpot alternatives.
Enola, however, is the better fit when the goal is clear business answers. It interprets patterns, validates context, generates hypotheses, and presents structured insights. Analysts benefit from the analysis plan and the statistical tests it proposes. Business users get concise answers without needing to decode a wall of charts.
Enola is a strong AI analyst that excels at meaning, context, and decision readiness. For this specific procurement question, Enola delivered more value because it gave me usable insights rather than raw data.
If reducing cognitive load, speeding up decisions, or scaling analysis are your priorities, Enola stands out in the landscape of AI analysts and analytics tools.
Related Blog:
Frequently Asked Questions
Is ThoughtSpot worth it in 2026?
ThoughtSpot is worth considering for large enterprises with dedicated data teams who need search-based analytics on top of a governed data model. However, its value diminishes for smaller teams or organizations where business users need to answer ad-hoc questions without analyst involvement. In 2026, newer AI-native platforms offer more conversational, autonomous analysis capabilities at a lower total cost of ownership than ThoughtSpot’s enterprise tier.
What is the best ThoughtSpot alternative?
The best ThoughtSpot alternative depends on your use case. For teams that need search-style analytics but with more autonomous AI reasoning, AskEnola is a strong alternative — it connects to your data warehouse, understands business context, and delivers multi-step analysis in natural language. Power BI with Copilot is another option for Microsoft-centric organizations. For pure conversational analytics without the need for pre-built data models, AskEnola’s approach is more flexible than ThoughtSpot’s reliance on TML definitions.
How does Enola compare to ThoughtSpot for data analysis?
Enola and ThoughtSpot both offer natural language querying, but they differ in how deeply they reason. ThoughtSpot relies on a pre-defined data model (TML) and delivers search-style answers tied to that model. Enola uses an agentic AI approach that can plan and execute multi-step analysis — decomposing complex business questions, identifying relevant data relationships, and delivering narrative recommendations, not just charts or numbers. Enola requires less data modeling upfront and handles more complex reasoning autonomously.
Which tool is better for non-technical users: Enola or ThoughtSpot?
For non-technical users, Enola is generally the better choice. ThoughtSpot still requires data teams to build and maintain the underlying data models before business users can query effectively. Enola is designed to work directly with your existing data warehouse with minimal setup, and its conversational interface is specifically optimized for business leaders who want to ask real business questions — not data questions — and receive decision-ready answers.