As an analytics professional, I often get asked, “What’s the best Tableau alternative these days?” In 2026, with AI making serious inroads into data analysis, this question isn’t just academic. I recently ran a head-to-head test comparing Tableau and Enola, an AI-driven platform that promises to do more than just visualize data. The goal? To understand how each performs on a core business use case: reducing procurement lead time.
Spoiler: Both tools have their merits, but the experience and effort required couldn’t be more different.
Why This Tableau Alternative Test Mattered
The use case and business question I picked for the test was simple but critical: How can we reduce the lead time for procurement?
Why it matters:
- Faster procurement reduces inventory holding costs and frees up capital.
- Quicker supplier response enhances reliability and mitigates disruption risks.
- Shorter lead times translate directly into improved customer satisfaction.
- Teams that can react to market demand faster get a strategic edge.
Basically, this wasn’t just a numbers exercise: it was about speed, insight, and business impact.
Setup and Workflow Comparison: Tableau vs. Enola
Tableau: Setup Requires Familiarity with Analytics
Setting up Tableau for this task involved a few standard steps:
- Preprocess the data.
- Import the CSV into Tableau.
- Create calculated fields to transform data as needed.
- Build visualizations manually, often using advanced LOD expressions.
Friction points quickly became apparent. Each new view required manual configuration, and Tableau offered no AI assistance to guide next steps. Every decision, from chart type to calculated field, fell on my shoulders.
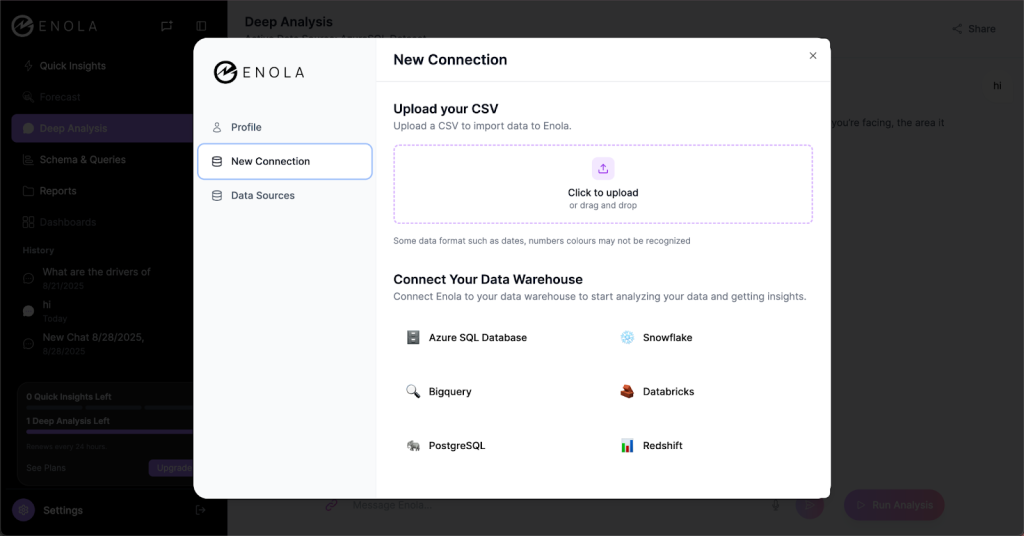
Enola: Simple and Fast Setup
Enola, in contrast, required minimal setup. I uploaded the file, asked plain English questions, and received structured answers almost immediately. Behind the scenes, the AI automatically profiled the data, highlighted correlations, and even suggested follow-up questions to refine analysis.
The difference was stark. With Tableau, I was doing the heavy lifting. With Enola, it felt like having a co-analyst who already knew the business context.
Using the Tools: Experience With Tableau and Its Alternatives
Tableau: Flexibility With Effort
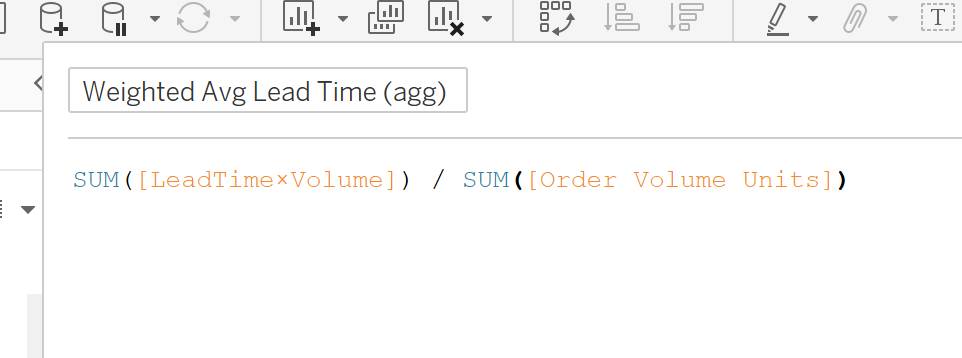
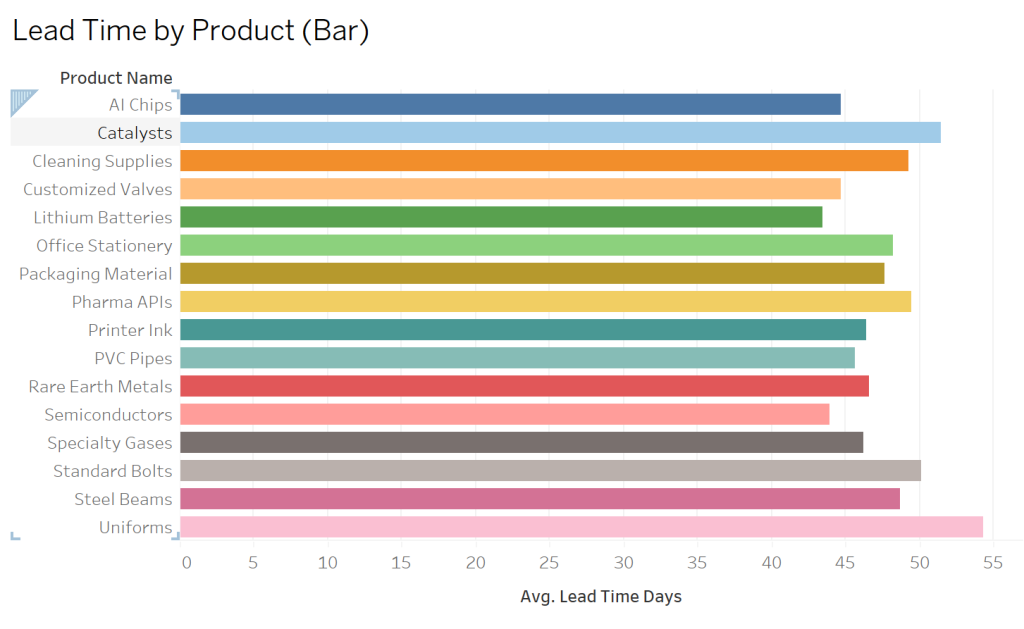
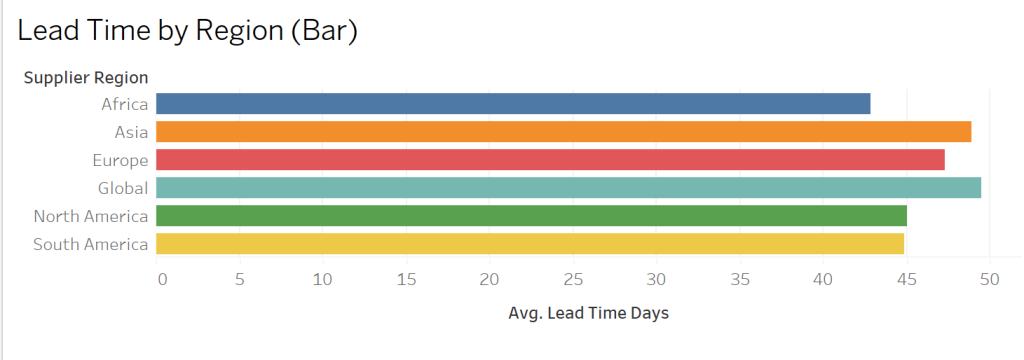
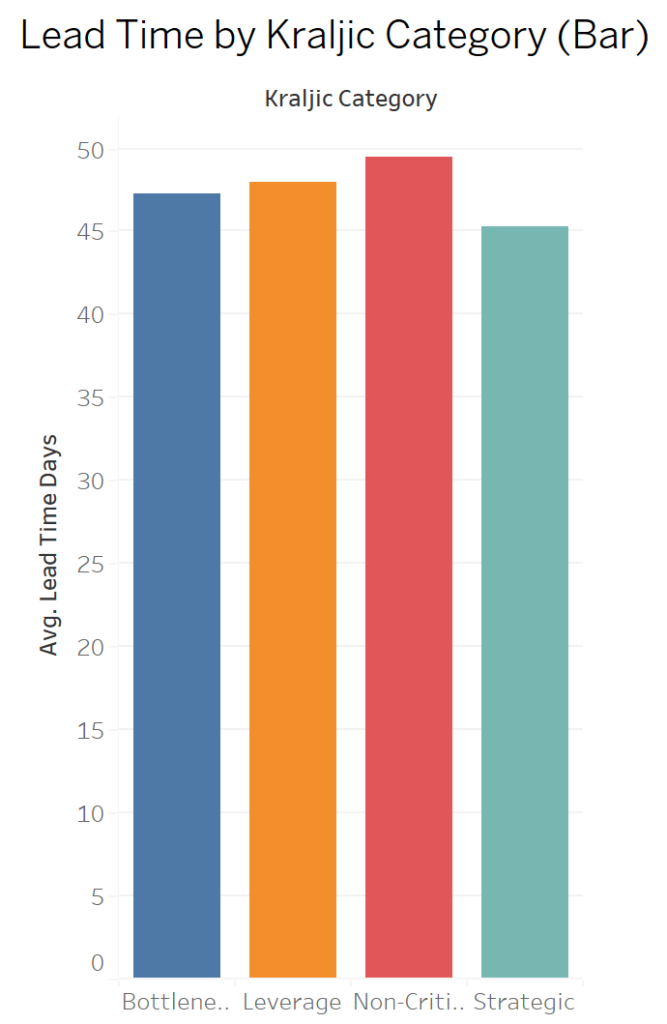
Tableau’s strengths lie in its flexibility. It connects to almost any data source, allows deep customization, and lets analysts create calculated fields and visualizations exactly the way they want. In my test, I appreciated that I could calculate weighted average lead times, segment by region and product category, and tailor charts down to the smallest detail.
But there’s a catch. Tableau demands time and strong analytical skills. For example, I had to create multiple fields like Weighted Avg Lead Time and Cost just to explore the data effectively.
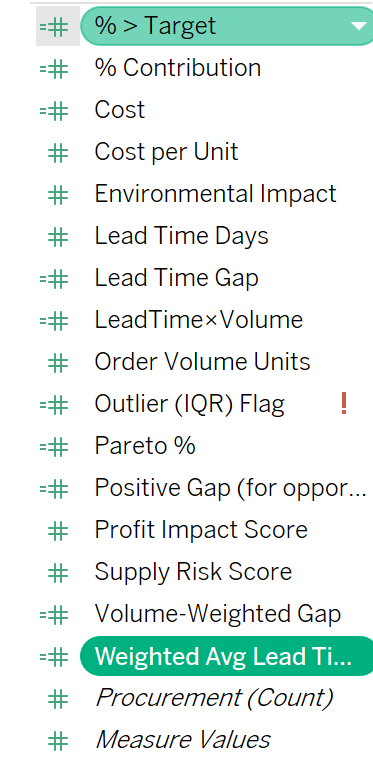
Extracting causal insights meant additional statistical work, like trend lines and scatter plots. Every chart must be created manually, often needing a solid understanding of Tableau and LODs.
I had to build four separate visualizations just to understand how average lead time varies across segments.

Once the charts were ready, the interpretation still rested on me. Tableau shows the data but doesn’t tell you what’s driving the patterns or why they exist, root cause detection or driver identification is entirely manual. In cases where the root cause is buried deeper in the data, identifying it requires strong statistical and analytical skills from the user, and significant manual effort is required to interpret results (e.g., scatter plots, R² values, trend lines).
In short, Tableau is powerful, flexible, but effort-heavy.
Enola: a Fast, Guided, and Insightful Tableau Alternative
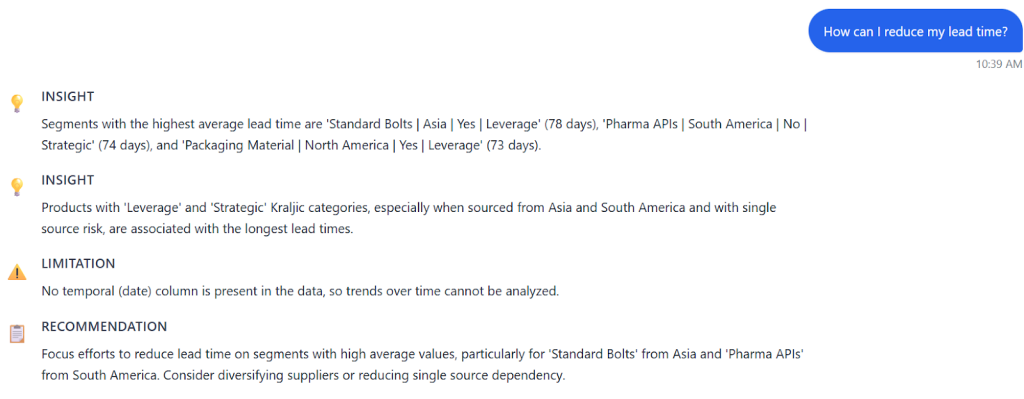
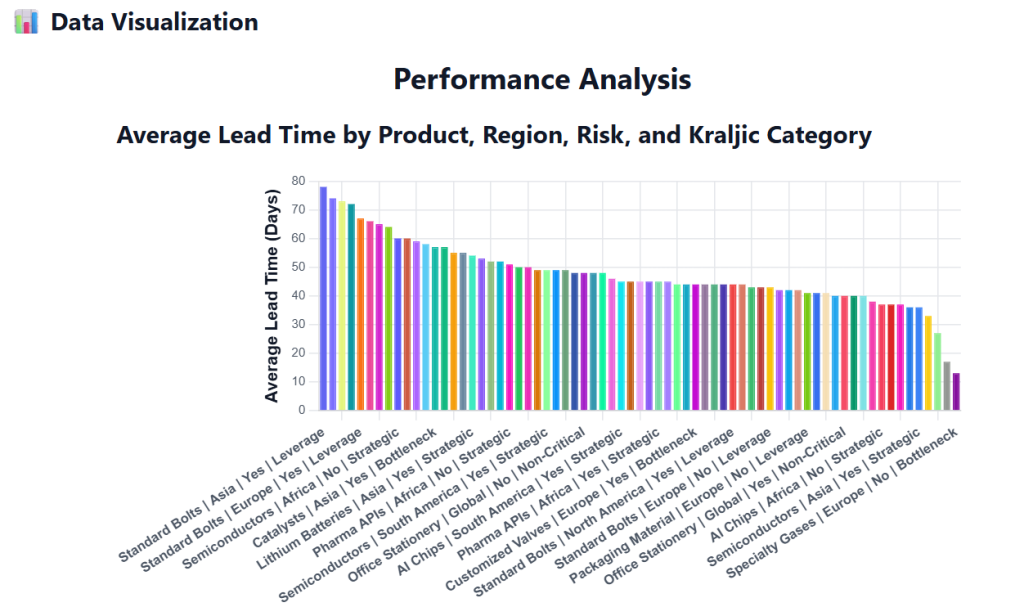
A single visualization highlighted average lead time across region, risk, and product category, making it immediately clear where bottlenecks occurred.
The ‘Deep Analysis’ feature then asked targeted follow-up questions: which product category mattered most, should negative trends be prioritized, what timeframe was relevant, and who the insights were for.
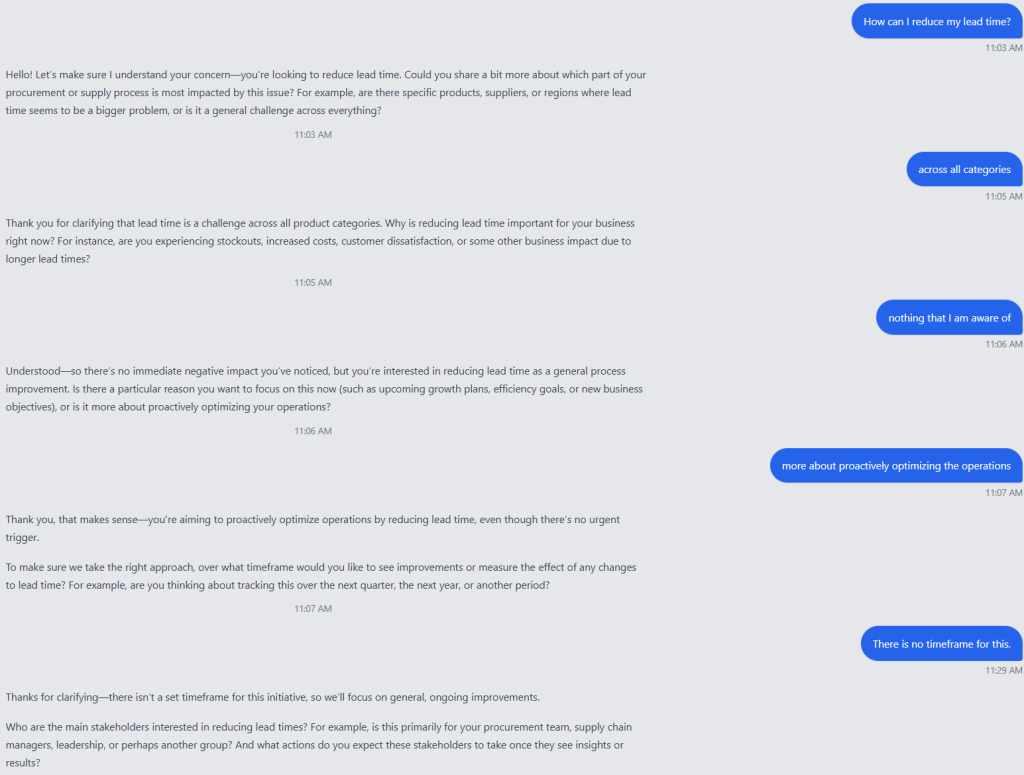
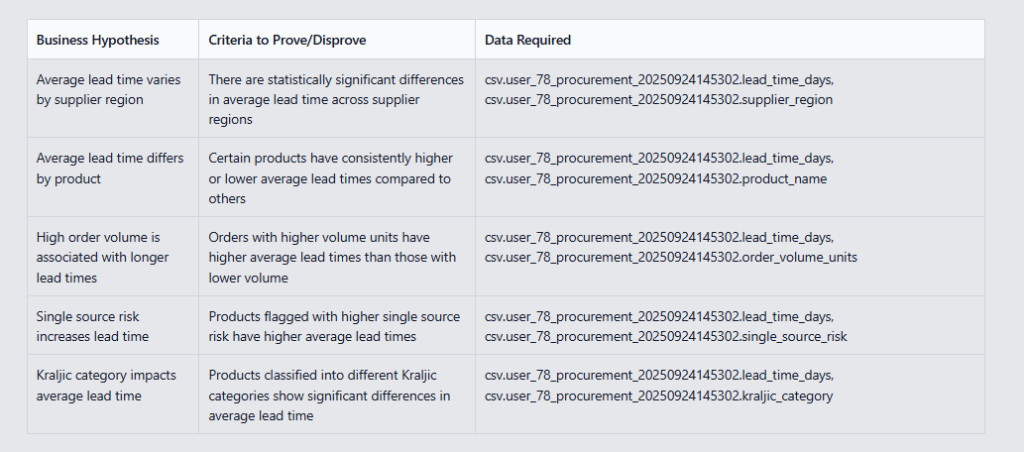
It even suggested hypotheses for reducing lead time, allowing me to adjust or add my own.
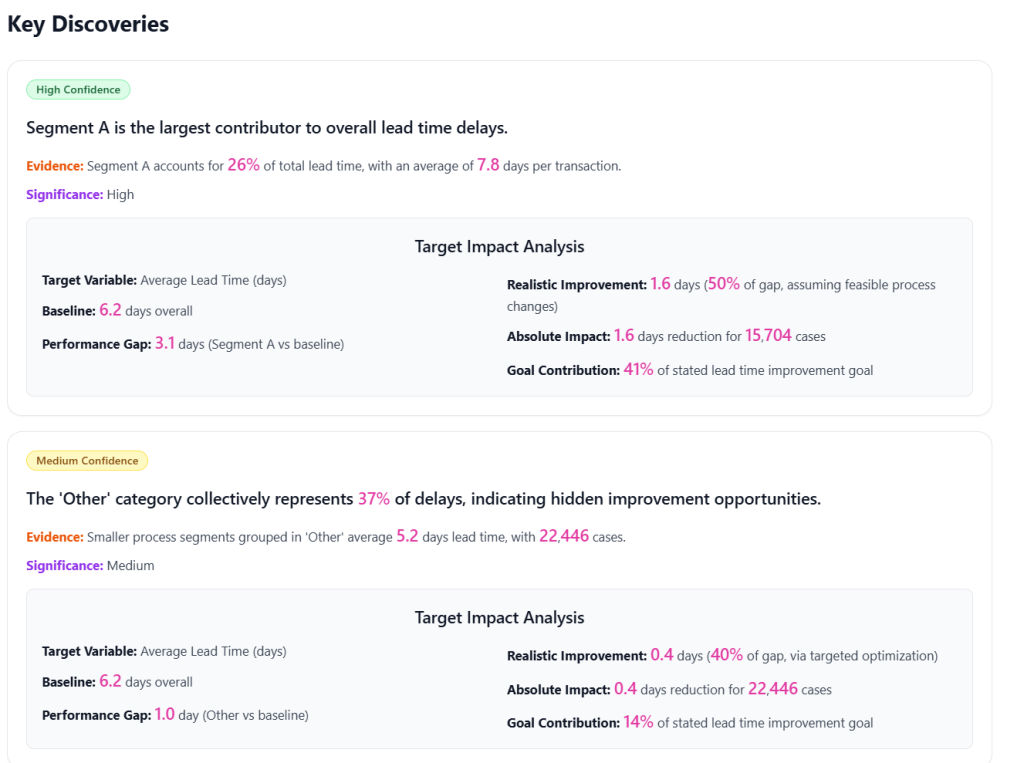
Enola’s output was structured like an executive-ready analysis plan, including summary, visualizations, and actionable recommendations.
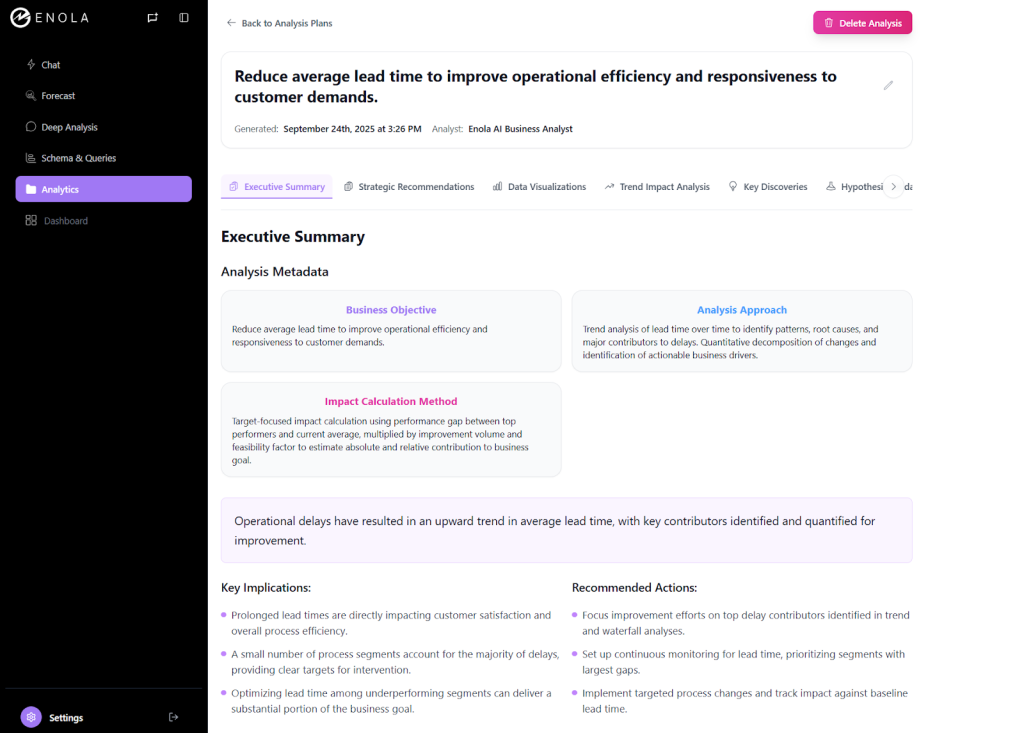
Enola didn’t just present data, it surfaced drivers and root causes automatically.
Speed and Efficiency
In terms of speed, the gap was massive.
Tableau setup, calculation building, and view testing consumed hours. Each new question required a fresh chart or filter. Enola produced initial insights in minutes, and iterating was as simple as asking the next question naturally.
For teams prioritizing fast, business-ready answers, this difference can translate into days of saved effort each month.
User Effort and Cognitive Load With Tableau and Enola
Tableau requires SQL or BI skills, understanding of dimensions and measures, and experience with LODs. Non-analysts can feel overwhelmed.
Enola significantly lowers the cognitive load. Asking a question in plain language generates actionable business answers without interpreting raw charts or calculations. While using Enola, it felt like having a co-analyst — it asked the right questions, automatically generated visualizations without any manual effort, and pointed me toward what mattered.
Tableau is not obsolete, and it makes complete sense for analysts who:
- Need full control over dashboards
- Enjoy designing highly customized visualizations
- Have time to dig into data relationships manually
As such, it remains a very strong tool. Its flexibility and customization are unmatched if you have the skills and bandwidth.
Enola, the Tableau Alternative, Takes the Lead
However, Enola clearly wins when:
- You want instant, business-ready insights from files or warehouses.
- Your team values clarity over customization.
- Quick iteration and low-effort analysis matter more than handcrafted dashboards.
It is a genuine tableau alternative for organizations seeking AI-driven guidance for everyday analytics questions. Enola helps teams see patterns, identify drivers, and make recommendations without waiting for hours or relying on deep BI expertise.
Key Takeaway: Choosing Enola, the Perfect Tableau Alternative
Tableau offers flexibility and control at the cost of time and cognitive effort. Enola delivers guided, contextual insights with minimal setup.
Put simply: Tableau is for the analyst who enjoys building dashboards and extracting insights manually. Enola is for those who want analyst-level results—speed, structure, and business-ready recommendations—without necessarily spending the time and money that the human-led analysis process requires.
For anyone searching for tableau alternatives in 2026, the choice depends on your team’s priorities: handcrafted dashboards or fast, guided insights.In my opinion, in a fast-moving business world, speed and clarity often trump exhaustive customization. After testing both tools on a core procurement use case, I can confidently say that Enola redefines what a tableau alternative can do. It doesn’t just display data, it helps users understand it, reason through it, and act on it faster than ever before.
For anyone wondering whether AI-driven tools are just hype or practical helpers, my answer is clear: Enola is a case where AI genuinely amplifies analytics productivity, making everyday business decisions smarter and faster.If you want to explore more about how Enola works, check out askenola.ai.
Related Blog: