
When I began my career in analytics over two decades ago, every meeting started the same way. Someone would open a slide deck, and we’d dive into what had happened, stuff like ‘Revenue went up by 8%’, ‘Customer churn increased by 3%’, or ‘Website traffic spiked last Tuesday.’ The data was clean, the charts were beautiful, and the analysis was technically sound, but the presentation and reporting were generally followed by silence.
The kind of silence that makes you realize everyone’s waiting for someone else to say, “So… now what?”
That question rarely got answered. Not because people weren’t smart, but because we’d all been trained to treat data as a rearview mirror. We were great at describing the past and terrible at prescribing actions for the future.
Fast-forward to today, when I am running my own analytics company, and most people are still stuck in the same loop. Sure, they are using fancier tools. The dashboards grow in real time, our models auto-refresh every night, and our business users have access to more data than ever. Yet most meetings still sound eerily familiar: “What happened last quarter?” “Why did this go down?” “What do the numbers say?”
If the goal of analytics is to drive better decisions, then stopping at “what happened” is like building a GPS that only tells you where you’ve been.
The Shift: From Rearview to Roadmap
The way I see it, true change in how we get the most from our data will only come about when analytics stops describing and starts guiding. When data stops being a static report and becomes an ongoing conversation about what to do next.
Let’s call it what it is: most analytics processes are designed for hindsight, not foresight. We clean, we model, we visualize, and then we stop. The people who actually make the decisions — product managers, marketers, finance leads — are handed a set of facts and told to “interpret.” It’s no wonder data-driven decision-making feels slow.
But here’s the secret that separates fast-moving companies from the rest: they’ve stopped asking analysts for answers and started asking questions like product managers would. Questions that begin with “What should we do?” not “What happened?”
This shift is not about adding another tool or running more regressions. It’s about reframing analytics as an interactive dialogue between data and decision.
Instead of “our revenue dipped 5%,” the better question is “which levers can we pull to grow revenue by 10%, and what will each one contribute?”
When that question becomes part of the culture — when analytics turns into a conversation instead of a report — everything changes. Decision latency drops. Accountability increases. Suddenly, you are no longer guessing which metrics to chase, because you already know the next steps that the metrics would help you take.
What Does This Shift Look Like in Practice
Let’s take the example of Susan, a VP-Product at an e-commerce company who wanted to understand her revenue drivers for 2024 and plan a strategy to increase total revenue by 10% in the following year.
Instead of going the traditional route and depending on her analytics team for this rather complex request, she decided to try out a conversational analytics tool. Here’s how the exchange unfolded:
Susan: What are the drivers of revenue for 2024? We’re also looking to increase the revenue by 10% by strategizing based on the insights for the upcoming year.
Enola: Could you tell me which part of your business (for example, certain product lines, regions, or customer segments) you think is most impacted by revenue performance?
Enola: We want to look at all segments and do a broader analysis.
Enola: Great. Have there been any recent changes like promotions or new products that might have affected revenue?
Susan: Nothing that I am aware of.
Enola: Understood. Who are the stakeholders for this analysis?
Susan: Marketing and finance teams.
Enola: Perfect. We’ll identify the main internal revenue drivers for 2024 and help marketing and finance plan strategies to reach the 10% revenue increase next year.
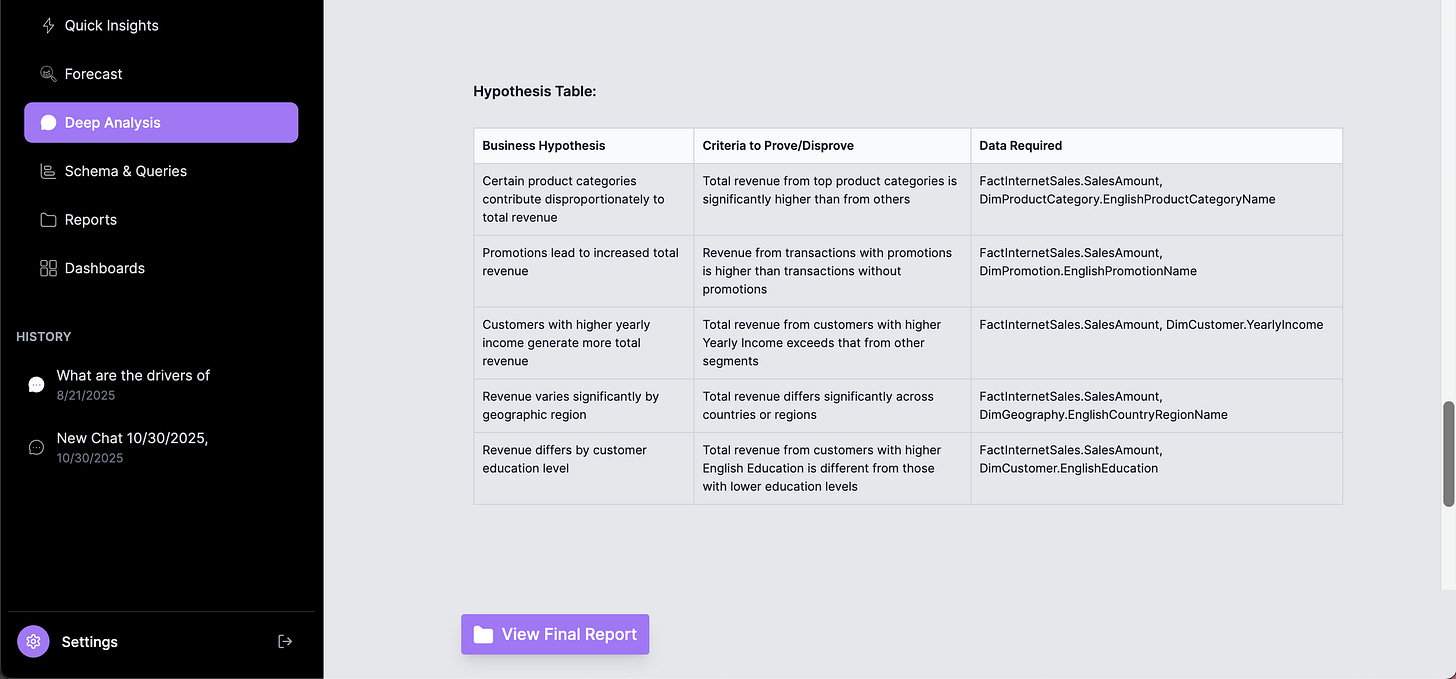
On request, Enola then generated hypotheses automatically:
- Certain product categories might contribute disproportionately to total revenue.
- Promotions may lead to higher transaction value.
- Customers with higher incomes could be driving more revenue.
- Geographic and education-level differences might exist, but need quantification.
Once approved, it ran a driver analysis across millions of rows of data, tested the hypotheses, and quantified each factor’s contribution to revenue growth.
The final insights were stunningly clear:
- Product category and customer income level together explained over 75% of the variation in total revenue.
- Promotions had a positive but limited impact, roughly 10% of the growth goal.
- Geography and education offered minor incremental gains.
In less than an hour, the business had a roadmap with quantified levers, each tied to an impact estimate. They knew that if they focused on top product categories and high-income customer segments, they could reach 73% and 32% of their 10% growth target, respectively, with clear action steps, ownership, and timelines.
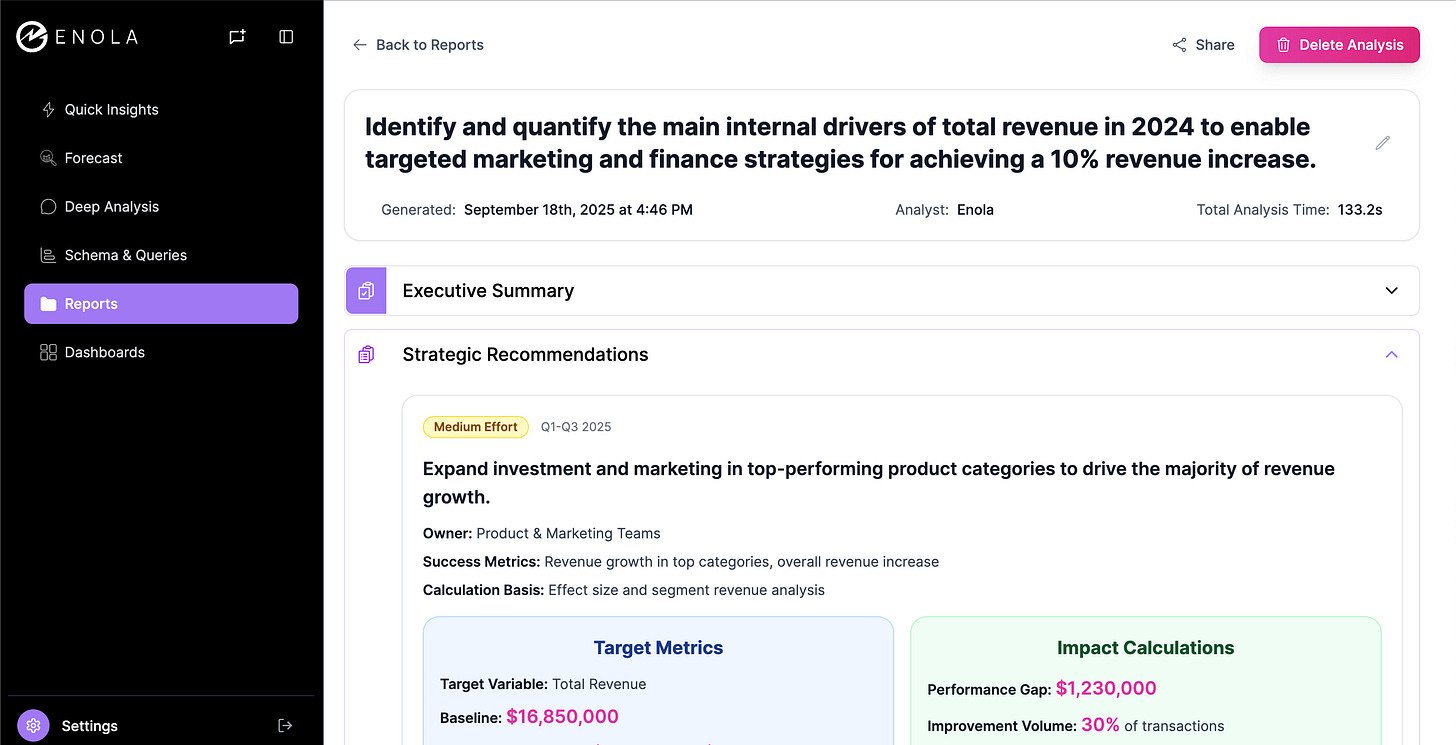
This wasn’t a “what happened” analysis. It was a “what should we do next” blueprint.
Why Conversations Beat Dashboards
As an analyst, I’ve spent a lot of time watching people stare at dashboards trying to find meaning. Don’t get me wrong, visualization tools are powerful (tools like Enola have them too, of course). But dashboards are passive, and they need the user to take all the cognitive load.
Conversational analytics flips that equation.
It guides you to the right questions, clarifies your intent, and builds the analysis around your goal. It doesn’t assume you know which metric matters. It helps you find out.
Think of it as the difference between a map and a tour guide. The map shows you all the routes; the guide listens to where you want to go and takes you there.
In this e-commerce example, the tool wasn’t just responding to queries; it was reasoning through the business context. It asked clarifying questions, refined the scope, generated hypotheses, ran statistical tests, and translated results into recommended actions, all in a single thread.
That’s not just analytics. That’s applied intelligence.
How to Make This Shift in Your Organization
You don’t need to buy new software tomorrow to start thinking this way. The first step is cultural, and from then on the BADIR™ framework can provide a structured way to about it.
Here’s what I tell every team I work with:
- Ban the question “What happened?” Replace it with “What should we do about it?” This forces every analysis to have an action hypothesis built in.
- Start every project with a goal, not a dataset. Define success in business terms before touching the data.
- Design for dialogue. Whether through a conversational interface or a collaborative framework, make sure analytics isn’t one-way.
- Quantify your drivers. Always tie insights to measurable impact: how much of your goal each driver can realistically move.
- Hold your analytics accountable. If an analysis doesn’t change a decision, it’s not valuable.
Once teams internalize this, new-age analytics solutions can amplify their impact because they speak the language of business goals, not just data fields.
The next time someone asks you for a report, ask them a question back:
“Do you want to know what happened, or what to do next?”
That one shift changes everything.
Now, if you do want to give conversational analytics a try, I’d suggest you do it right away. It’s incredibly simple with Enola, and all you need to do is follow these simple steps:
- Sign up in a matter of seconds.
- Use the pre-loaded sample dataset, or connect your own data to ask questions across domains like marketing, sales, finance, and operations.
- Receive structured, actionable answers that save time and remove uncertainty.
This post was originally published on Piyanka Jain’s Substack.
Related Blog: