Today, organizations use many product analytics tools to track user journeys, engagement, and growth, and other important metrics. Therefore, this access to data has made it easier to monitor performance across functions and identify areas of opportunity.
However, when it comes to answering specific business questions, such as what is driving retention or which segment contributes most to revenue, the process is not always straightforward. Often, teams move between multiple dashboards and reports to get a complete view of the data to answer their questions.
This highlights a growing need, not for more data but, rather, a need for more efficient and effective analytics tools to convert the existing data into actionable insights that can support timely decisions.
Too Many Analytics Tools
Over the past decade, there has been a wide range of analytic tools available for companies to choose from in order to analyze how well they’re performing: User engagement, Retention, and Growth have all become possible with the information provided by each tool. Each analytic tool has its own set of advantages and offers different levels of insights into user engagement.
However, the more tools a company has, the more fragmented the data becomes.
For example, marketing teams may use one analytic dashboard to analyze their campaigns; however, the product teams will most likely have a different analytic tool they’re utilizing for analyzing product feature usage, and the finance teams will have yet another dashboard to track revenue metrics.
As a result, organisations can have conflicting data numbers across departments, and therefore, the confusion can be time-consuming. This also puts a strain on the organisation’s ability to grow quickly and creates uncertainty at critical moments.
Lack of Clear Answers
Many teams believe that gathering additional data will enhance their ability for informed, data driven decision making. In fact, this is not always the case.
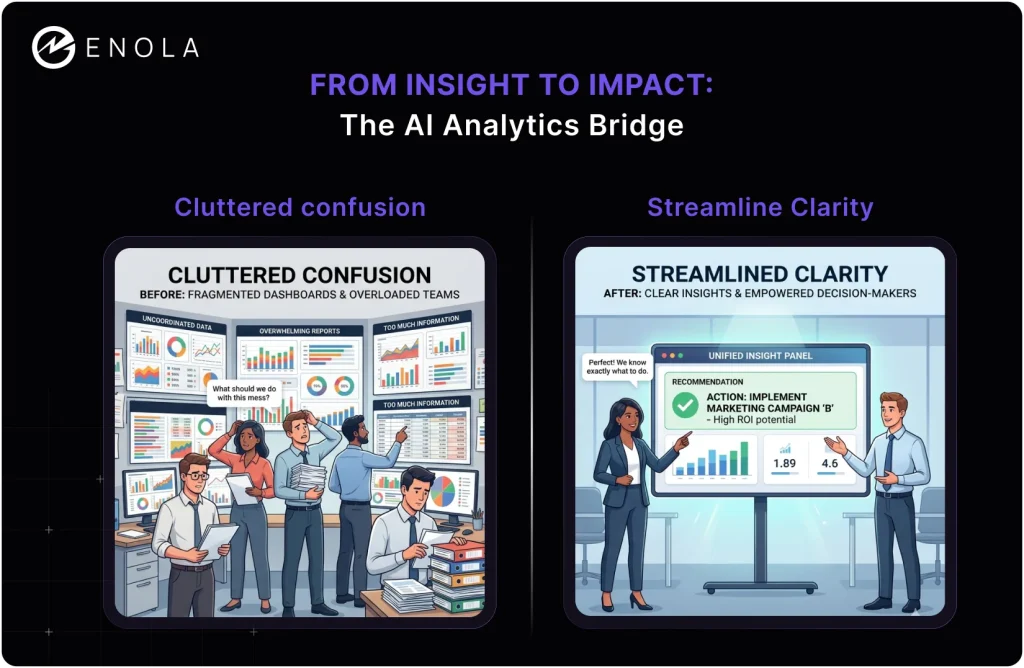
When there are too many dashboards available, it is difficult for teams to determine what is truly important. Key signals can get lost in the clutter. Reports indicate what is happening, but do not typically indicate why it is happening or suggest next actions.
This is where the insight-to-action gap begins. Teams see the situation but are unable to identify how to proceed. Without clear guidance, data becomes passive rather than useful.
Slow Decision Making
There is an immediate impact when no action is taken on insights. Delays in product improvements, less effective marketing campaigns, and lost revenue opportunities all can occur as a result.
Typically, teams depend on analysts to bridge the gap between raw data and business decisions, but heavy dependency can create bottlenecks. With constant requests piling up, competing priorities, and the average waiting time for an answer can extend to days or weeks.
In fast-moving consumer apps, these decision delays can make it difficult for businesses to stay competitive.
Fragmented Customer Insights
One of the biggest challenges lies in how businesses interpret user behavior. Most businesses invest in customer behavior analytics, but the insights can often be surface-level.
For example, a drop in user engagement might be visible in one dashboard, while another dashboard might show a decline in session time. However, without bringing these signals together to produce customer data insights, teams can be left guessing about important customer engagement metrics. Thus, making reactive decisions rather than strategic ones.
Need for Better Analytics Approach
Businesses need to rethink their use of analytics tools for apps in order to address the insight into action problem. The emphasis should not be on adding dashboards, but rather on the delivery of faster and clearer answers to questions.
There shouldn’t be a need for teams to decipher complex reports; instead, using tools should deliver direct insights associated with business questions. Such as:
- Why did retention decrease last week?
- Which user segments are growing revenue?
- What features are producing churn?
This can reduce the amount of ambiguity and allow teams to make forward and confident decisions
Contextual Clarity
Data without context often creates misrepresentation. Therefore, it is important that businesses move beyond traditional tools and adopt product analytics tools that understand business goals.
Contextual intelligence helps to connect metrics to results. This means understanding not just what happened, but also why it happened. This is important in effective data driven decision making, especially in a competitive business environment.
For example, knowing that conversion rates dropped is useful. But also getting insights if the drop is linked to a specific user journey issue is far more valuable. It turns observation into action.
How AskEnola Solves the Insight-to-Action Gap
AskEnola addresses the core problem of fragmented insights by turning complex data into clear, decision-ready answers. Rather than relying on scattered app analytics tools, it allows teams to ask questions in simple conversational language and receive structured insights instantly.
Using its BADIR framework, AskEnola connects business goals, analysis, data, and recommendations into a single seamless flow. This ensures each insight is actionable, accurate, and aligned to the key metrics, helping teams move from confusion to confident decisions faster.
Turning Insights Into Action
The future of analytics lies not in expanding the number of tools, but in improving how effectively teams access, interpret, and act on data. To do this, businesses need the ability to integrate customer behaviour analytics along with context and clarity. This will allow teams to access insights faster and more accurately and, therefore, to take action more quickly.
Thus, teams can be proactive in making better decisions. This leads to improved product experiences, better retention rates and increased revenue growth. Additionally, organisations can gain confidence in their decisions and stop second-guessing the numbers they see, and instead begin to focus on the outcomes achieved.
How could insights from data solve a problem?
Insights from data can help identify the root cause of a problem, such as finding why customer churn increased after a pricing change. This allows teams to take targeted actions instead of relying on guesswork.
Which analytics tool is best?
The best analytics tool mostly depends on the business need, such as reporting, visualization, or real-time insights. Ask Enola is a leading choice for businesses seeking automated, AI-driven insights without manual data digging. Other tools include Power BI, Tableau, and Google analytics.
What are the 4 pillars of data analysis?
The four pillars of data analysis are data collection, processing, analysis, and interpretation. Each step helps turn raw data into contextual insights that support decision-making.
What are the key benefits of augmented analytics?
Augmented analytics helps users quickly understand data by automatically highlighting trends and patterns. This helps reduce manual effort and supports faster and more confident decision-making.
Related Blog: